
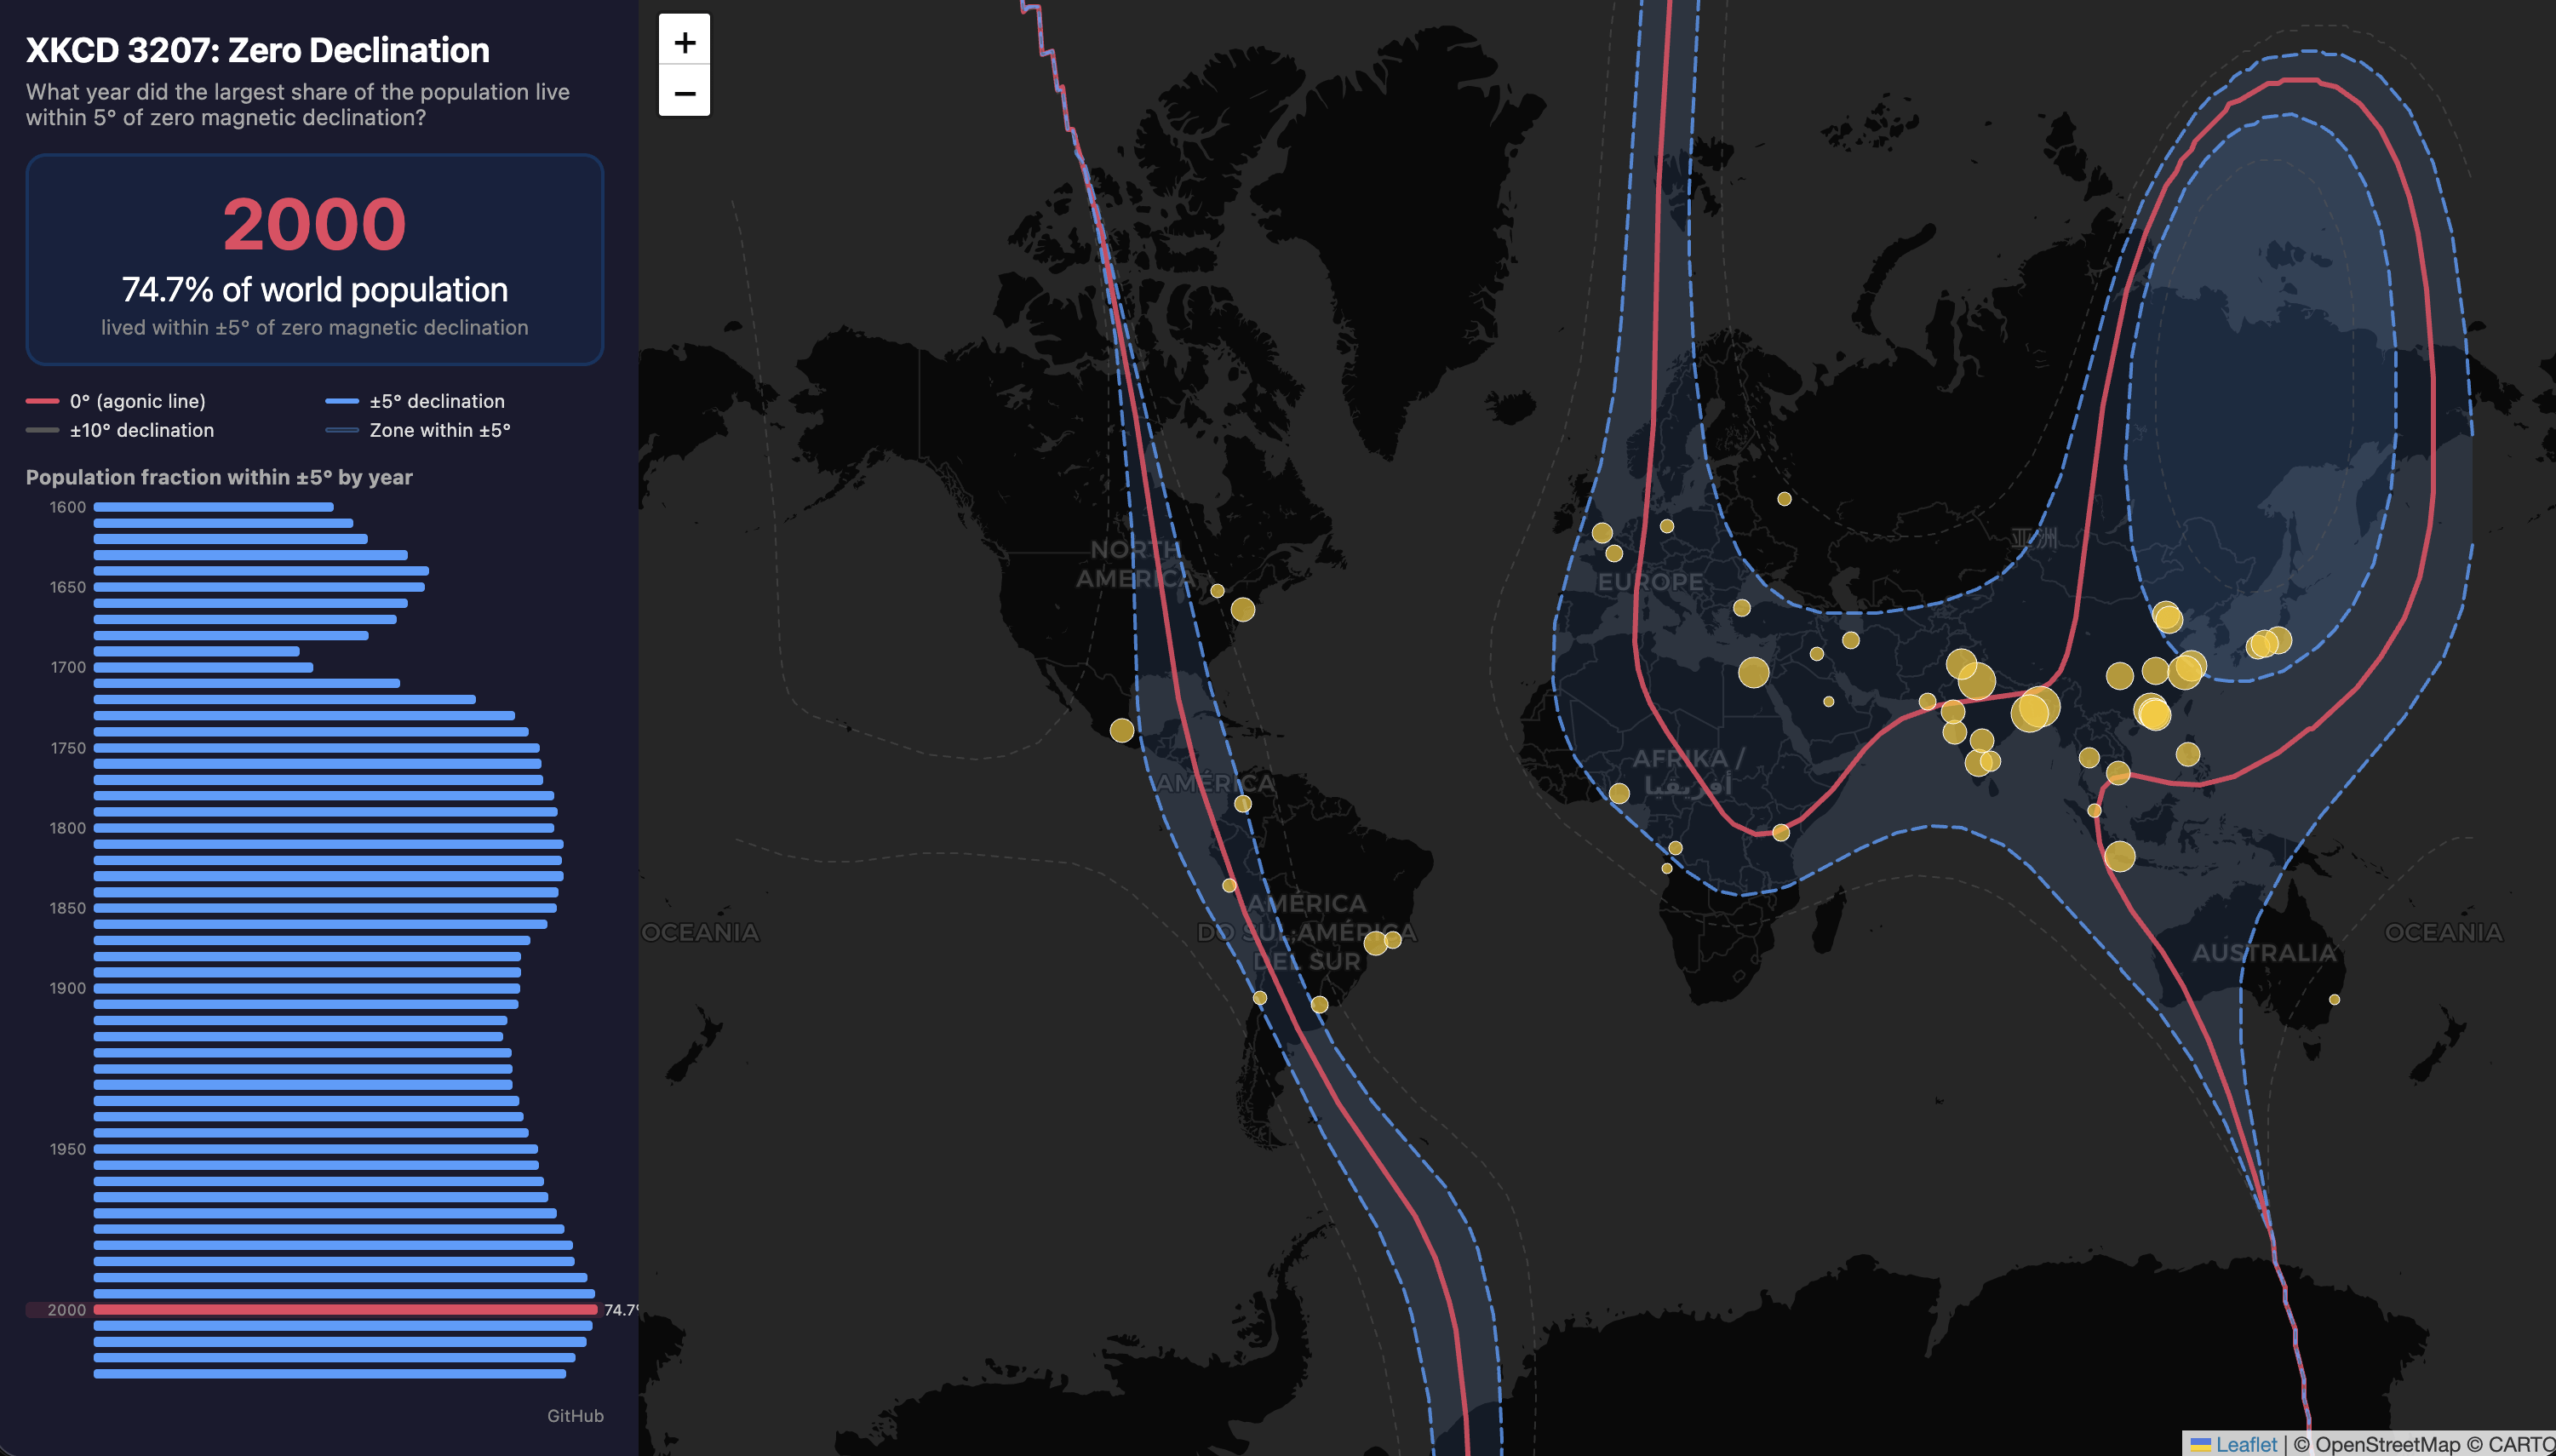
I got nerd sniped by the title text of XKCD 3207:
'The zero line in WMM2025 passes through a lot of population centers; I wonder what year the largest share of the population lived in a zone of less than 5° of declination,' he thought, derailing all other tasks for the rest of the day.
With some help from Claude Code, I built an interactive visualization to answer the question.
by ahogue
2 Comments
Data sources:
[](https://github.com/awhogue/zero-declination#data-sources)
* **Magnetic declination (1590–1985):** [gufm1](https://royalsocietypublishing.org/doi/10.1098/rsta.2000.0569) model via `pymagglobal`
* **Magnetic declination (1990–2025):** [IGRF-14](https://www.ngdc.noaa.gov/IAGA/vmod/igrf.html) via `ppigrf`
* **Population (1600–2020):** [HYDE 3.3](https://public.yoda.uu.nl/geo/UU01/94FNH0.html) gridded historical population
Code: [https://github.com/awhogue/zero-declination](https://github.com/awhogue/zero-declination)
Tools: Claude Code (Opus 4.6 medium effort)
Thank you for your service
Instead of an xkcd being for something, there’s now something for an xkcd