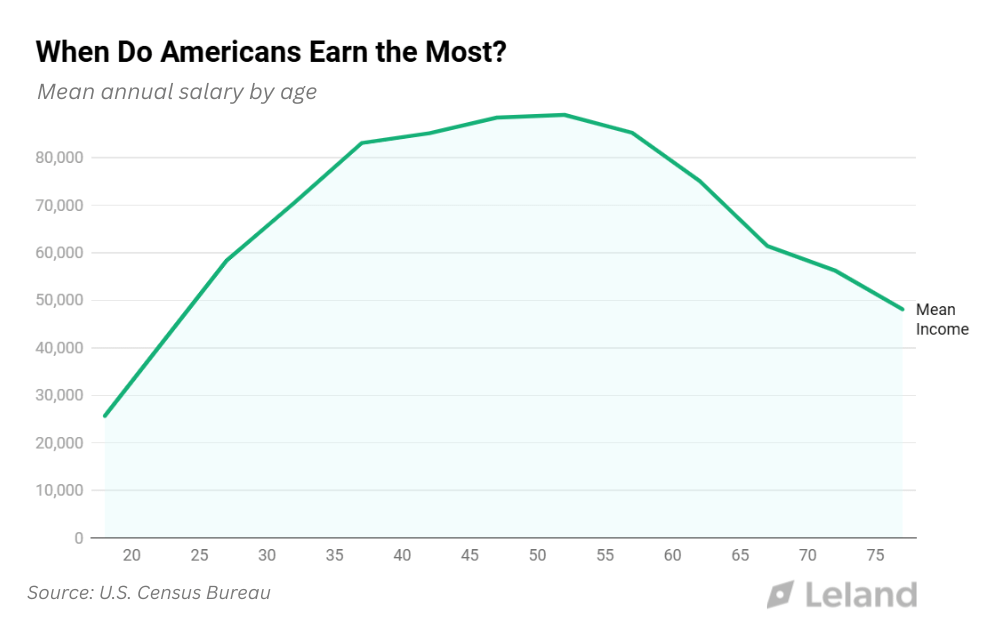
Mean Annual Income by Age in the U.S. (CPS 2025 Annual Social and Economic Supplement) [OC] by HenryFromLeland
HenryFromLeland on February 13, 2026 9:11 pm *Source: CPS 2025 Annual Social and Economic Supplement* *Created with Datawrapper*
SNRatio on February 13, 2026 9:28 pm For ages 50 and up this isn’t really a salary graph, it’s a graph of “your age at your last layoff” vs “Chance of getting another job in your field”

4 Comments
*Source: CPS 2025 Annual Social and Economic Supplement*
*Created with Datawrapper*
For ages 50 and up this isn’t really a salary graph, it’s a graph of “your age at your last layoff” vs “Chance of getting another job in your field”
mean is somewhat meaningless in skewed distributions.
Love bringing the mean down by making only half of it 😎