Data Source: Yahoo Finance API using Python yfinance.
Tool: Python, Pandas, and Seaborn for visualization.
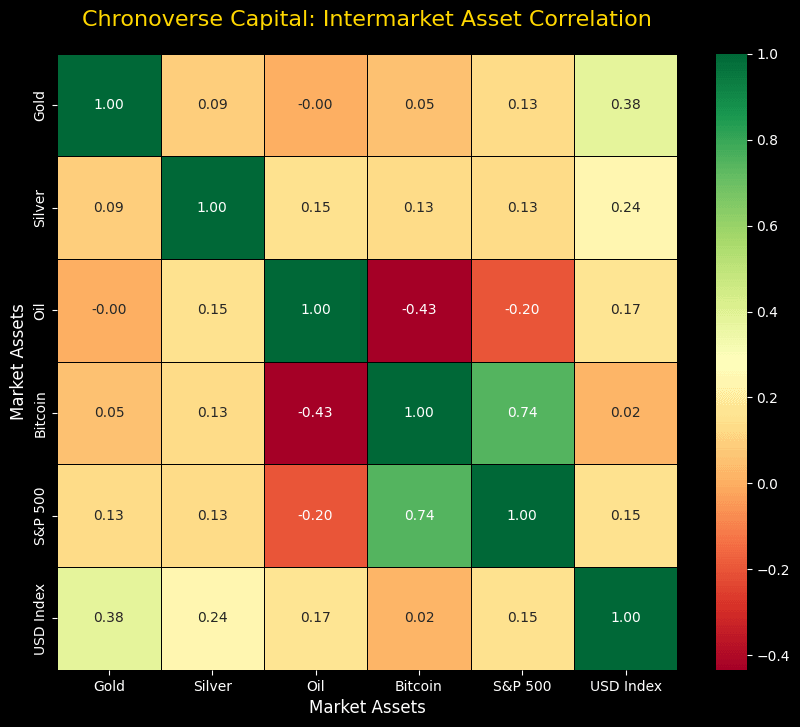
Analysis: This heatmap shows the Pearson correlation coefficient of daily returns for major assets over the last 365 days. It highlights the decoupling of Gold from the USD index and the high correlation between Bitcoin and the S&P 500.

1 Comment
Data Source: Yahoo Finance API using Python yfinance.
Tool: Python, Pandas, and Seaborn for visualization.
Analysis: This heatmap shows the Pearson correlation coefficient of daily returns for major assets over the last 365 days. It highlights the decoupling of Gold from the USD index and the high correlation between Bitcoin and the S&P 500.