
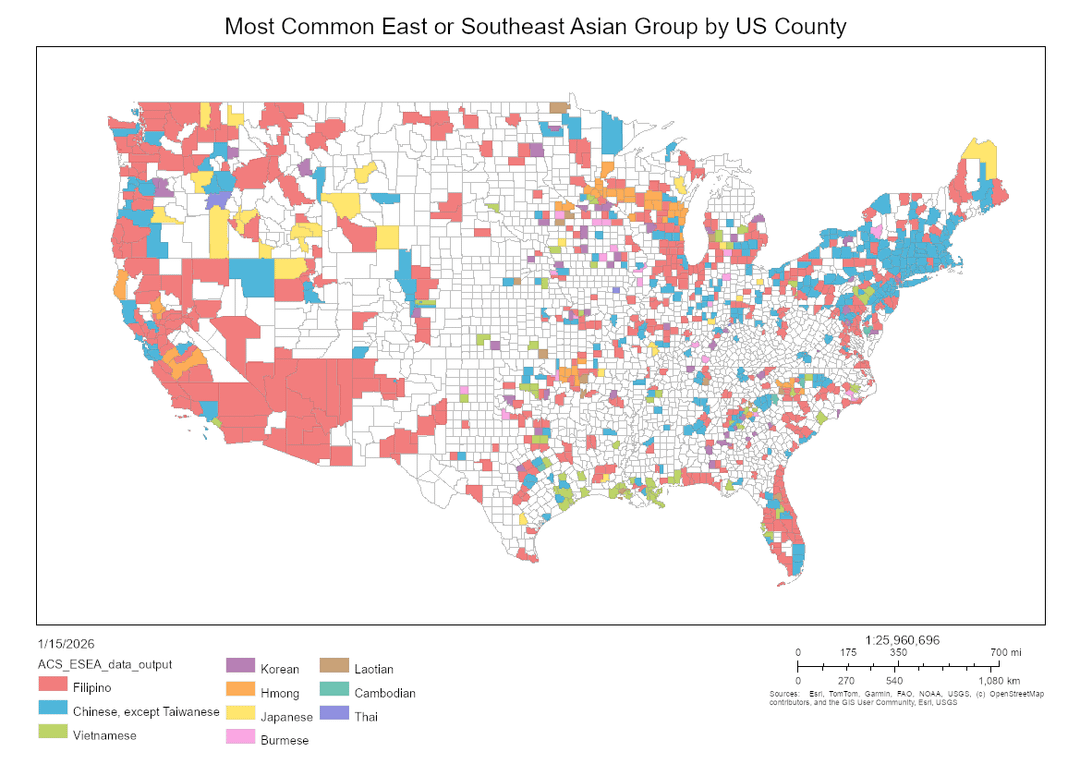
I made a modified version of u/VineMapper's maps of Asian ethnicities in the US where I combined East Asian and Southeast Asian into one category. For some reason Hmong are counted as "East Asian" in the ACS dataset, even though most Hmong Americans came here from Laos in Southeast Asia. I used the exact same data sources as they did in their 2025 posts in r/MapPorn– the 5-year ACS estimates from 2023.
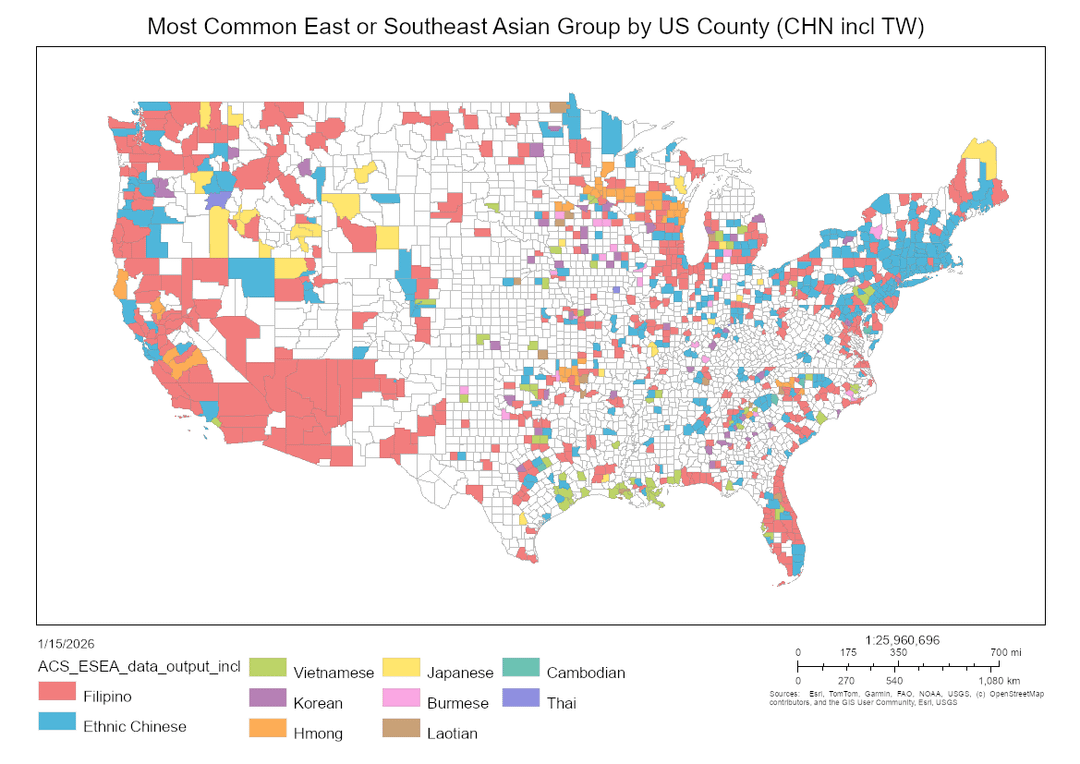
I wanted to see if the map would look any different if I used a combined "Chinese + Taiwanese" category, which I posted about here
by chilispiced-mango2
2 Comments
This is just self-reported census data, right?
Or does it come from nationality, where anyone who is an ROC national is considered Taiwanese?
|Year|Chinese Population|
|:-|:-|
|1850|4018|
|1860|34933|
|1870|64199|
|1880|105465|
|1890|107488|
|1900|118746|
|1910|94414|
|1920|85202|
|1930|102159|
|1940|106334|
|1950|150005|
|1960|237292|
|1970|436062|
|1980|812178|
|1990|1645472|
|2000|2432585|
|2010|3794673|
|2020|5205461|
Chinese who came from 1850 to 1900 account for 2.28% of the total current Chinese American population.
The Chinese Exclusion Act effectively terminated Chinese immigration during the 1910s – 1940s.
Those who arrived between 1950 and 1980 were mostly Chinese from outside mainland China, accounting for 6.33% of the current Chinese population.
Subsequently, after 1980, the large-scale immigration from mainland China made up 91.62% of the current Chinese population.