
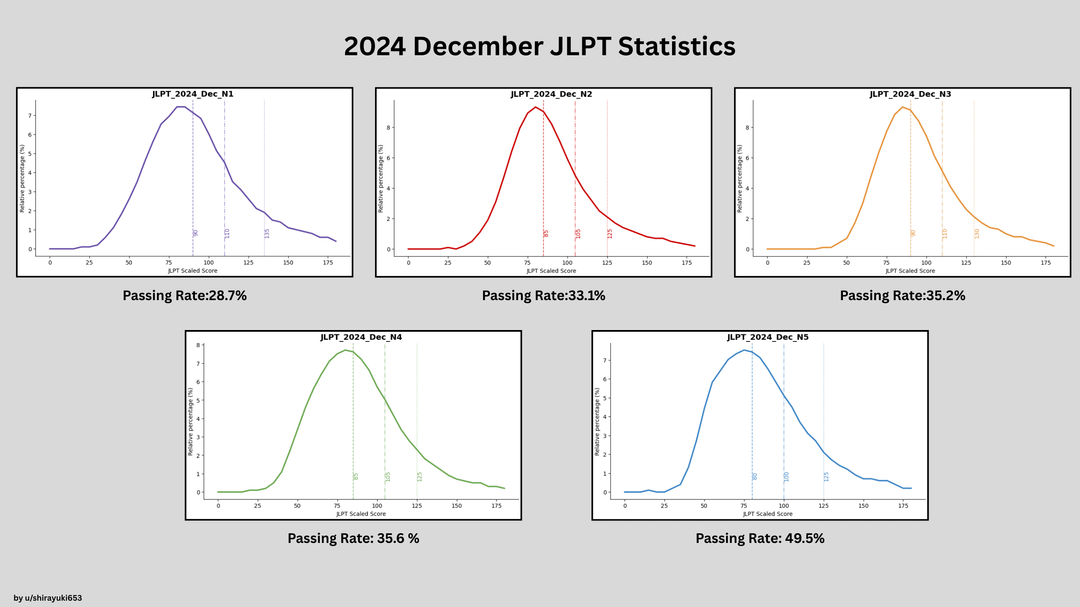
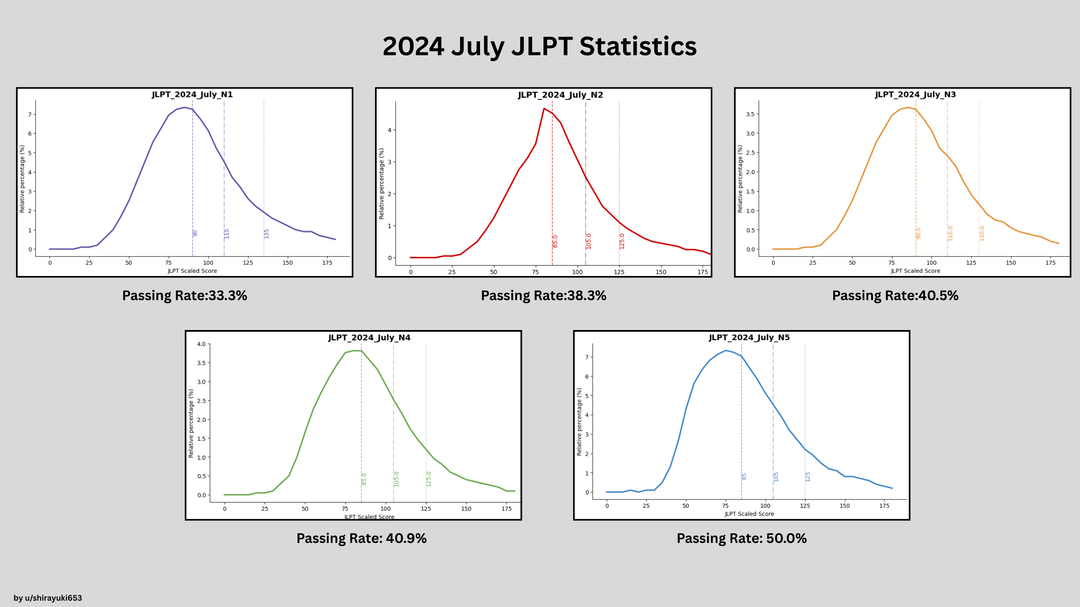
Visualisation of the 2024 JLPT (Japanese Language Proficiency Test) score distributions for July and December sessions across all levels (N5–N1).
Each panel shows the relative score distribution. Vertical lines indicate selected percentiles (median, 75th and 90th percentiles). Passing rates for each level are listed below the chart
Data source: Official JLPT statistics published by the Japan Foundation / JEES. Distributions were reconstructed from cumulative percentile tables by converting CDF values into discrete probability distributions using Python (pandas, matplotlib, seaborn).
Any suggestions to make the plot more appealing?
by shirayuki653
1 Comment
Do they have a score breakdown by section, like vocab, grammar, kanji, listening, etc?
Addition of demographic info would be neat too.