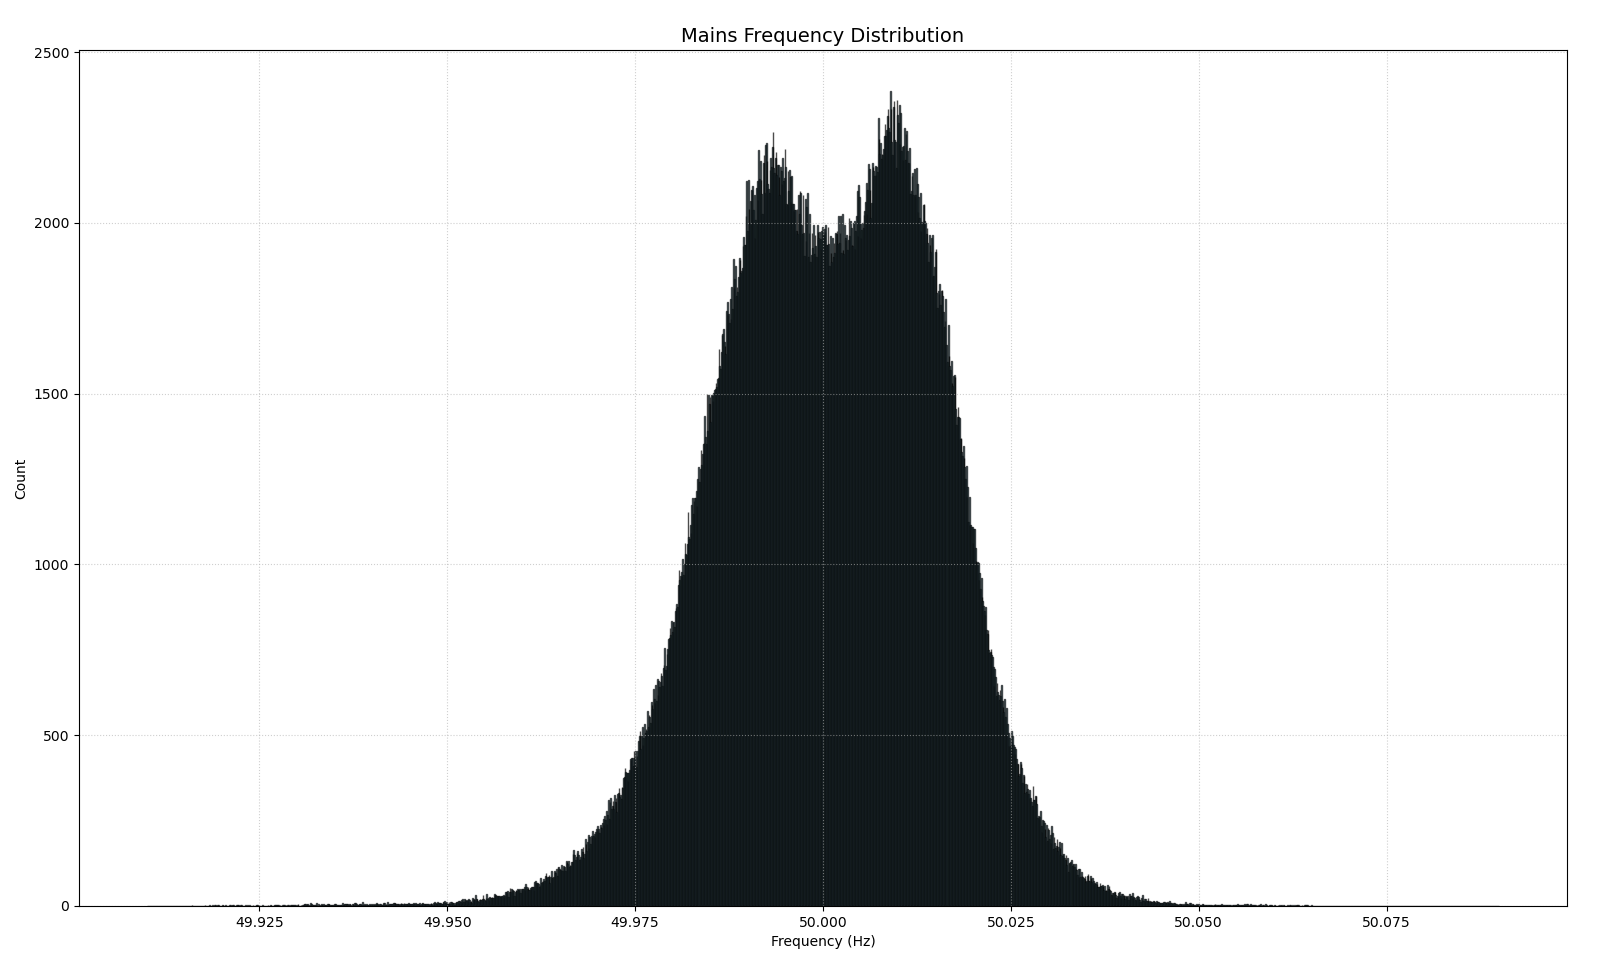
I was measuring the 50 Hz european electricity grid frequency every second for the past 10 days, and this is how often every frequency was counted (matplotlib) [OC]
I was measuring the 50 Hz european electricity grid frequency every second for the past 10 days, and this is how often every frequency was counted (matplotlib) [OC]

9 Comments
What did you use to measure with? Assume you measured zero crossing or so?
It’s a masterful feet to keep electric grids in balance and one hell of a disaster when it goes wrong
Any guess why this is a bimodel distribution?
I’m unfamiliar with electrical grids.
If the peaks were closer to the +/- 0.025 intervals would that be enough to be a considerable risk?
So that’s why my microwave clock goes off over time.
The variations can be due to the accuracy of measurements, no?
Since you have all the data, can you quickly calculate the average?
The frequency of frequencies
You should get a hold of Monarch. That looks like you might have a MUTO problem