
Sources: olympics.com athletes listing
Tools: Seaborn and Matplotlib for data visualization, Selenium for data collection
by golmschenk
Sources: olympics.com athletes listing
Tools: Seaborn and Matplotlib for data visualization, Selenium for data collection
by golmschenk
7 Comments
Would be interesting visualization to see also the winners as highlighted dots.
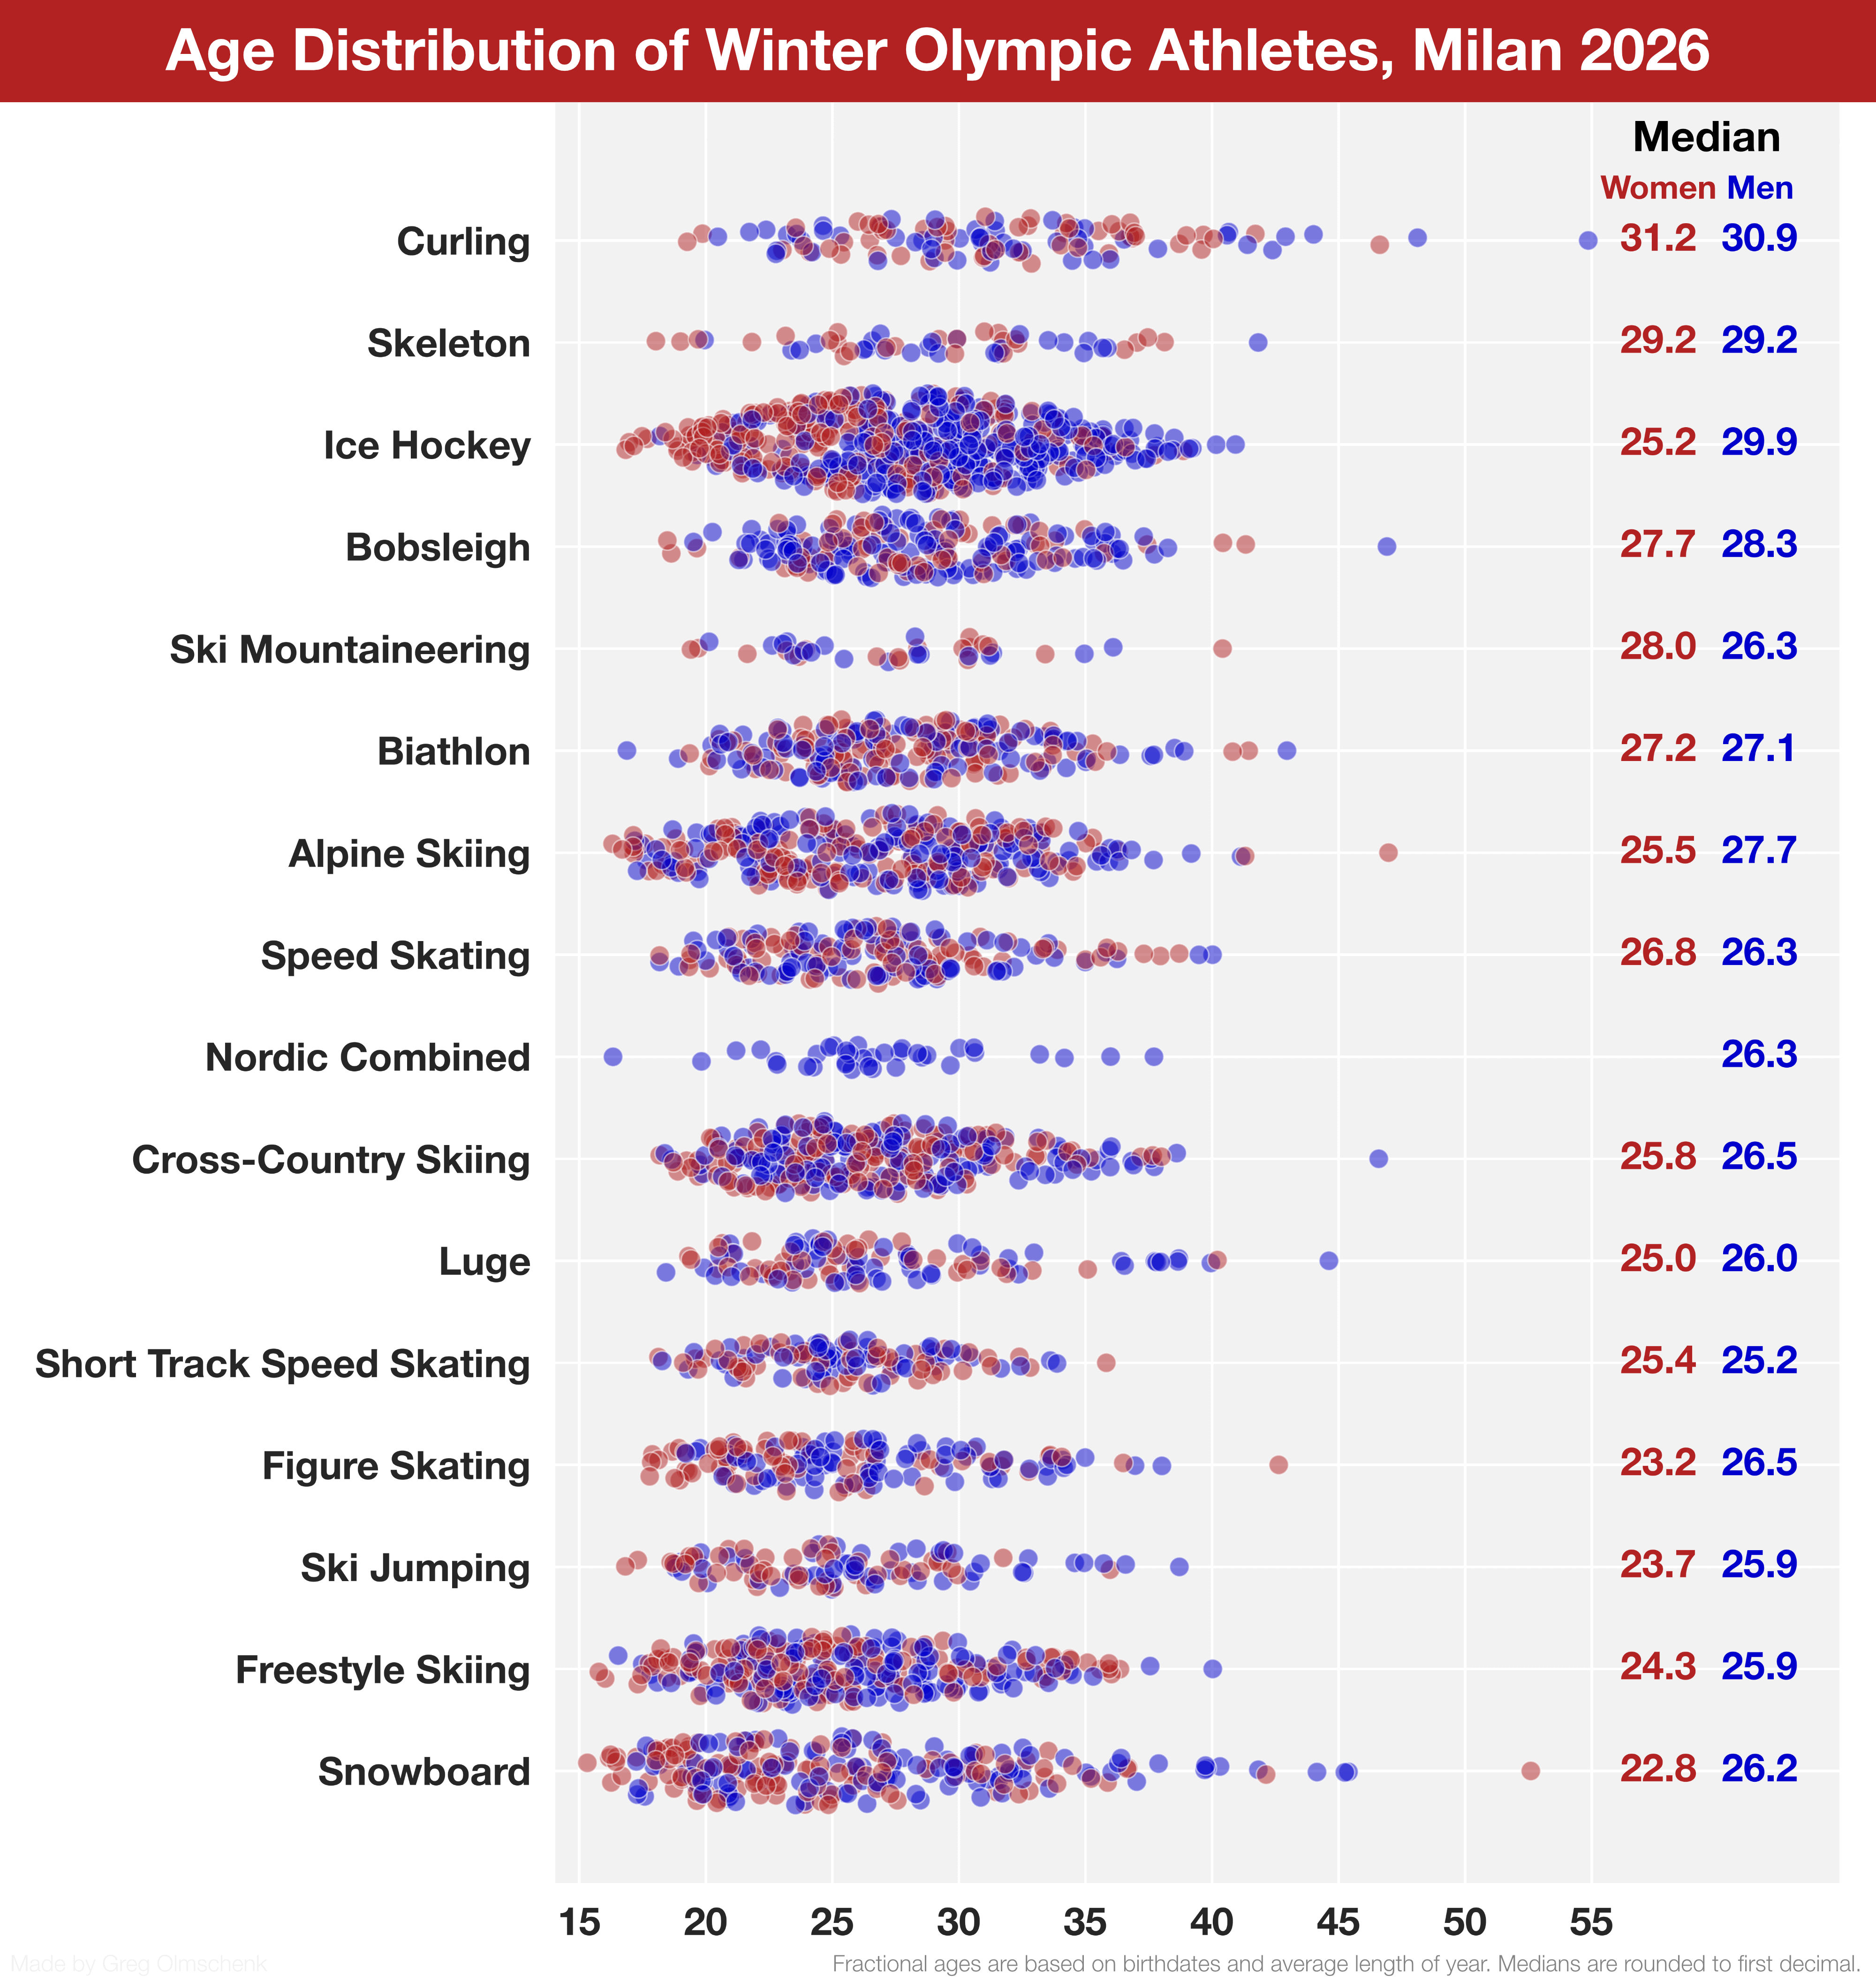
I was amazed at the age of a lot of men competing at the parallel giant slalom snowboarding. Do you know what the median age for that discipline was?
Incredible that a 52-year-old woman managed to qualify for the *Olympics* in snowboarding. Who is it?
there is a 50+ women snowboarder?!? holy smokes
Welp.. it looks like ive missed most of my Olympic years.
You wake up one day, look in the mirror and say to yourself. “Damn dude, your 32, you probably need to stop dreaming of being an Olympic level luge guy and hang it up.” And you do, you hang it up.
Still time to learn *checks notes* Skeleton
Great visualization for this size dataset; you can see the overall patterns plus all the details- e.g. that 50yo snowboarder!
Nitpicks:
* It might be interesting to see the two genders on seperate plots (?). Can’t really tell here if the shapes are similar or different, except hockey, where there are more college-aged females, which I presume is because there aren’t many pro female hockey players
* What’s the sort? Median age across gender? If so, it would be helpful to add that; otherwise the user burns some brain cycles trying to figure that out. Is it by the red numbers? Nope, bobsled > ice hockey. Blue? Nope, ice hockey > Skeleton. Overall median? Maybe? You could add the overall medians as grey bars for each chart perhaps.
* Perhaps make some logical combinations for smaller sports? E.g. skeleton and luge.