
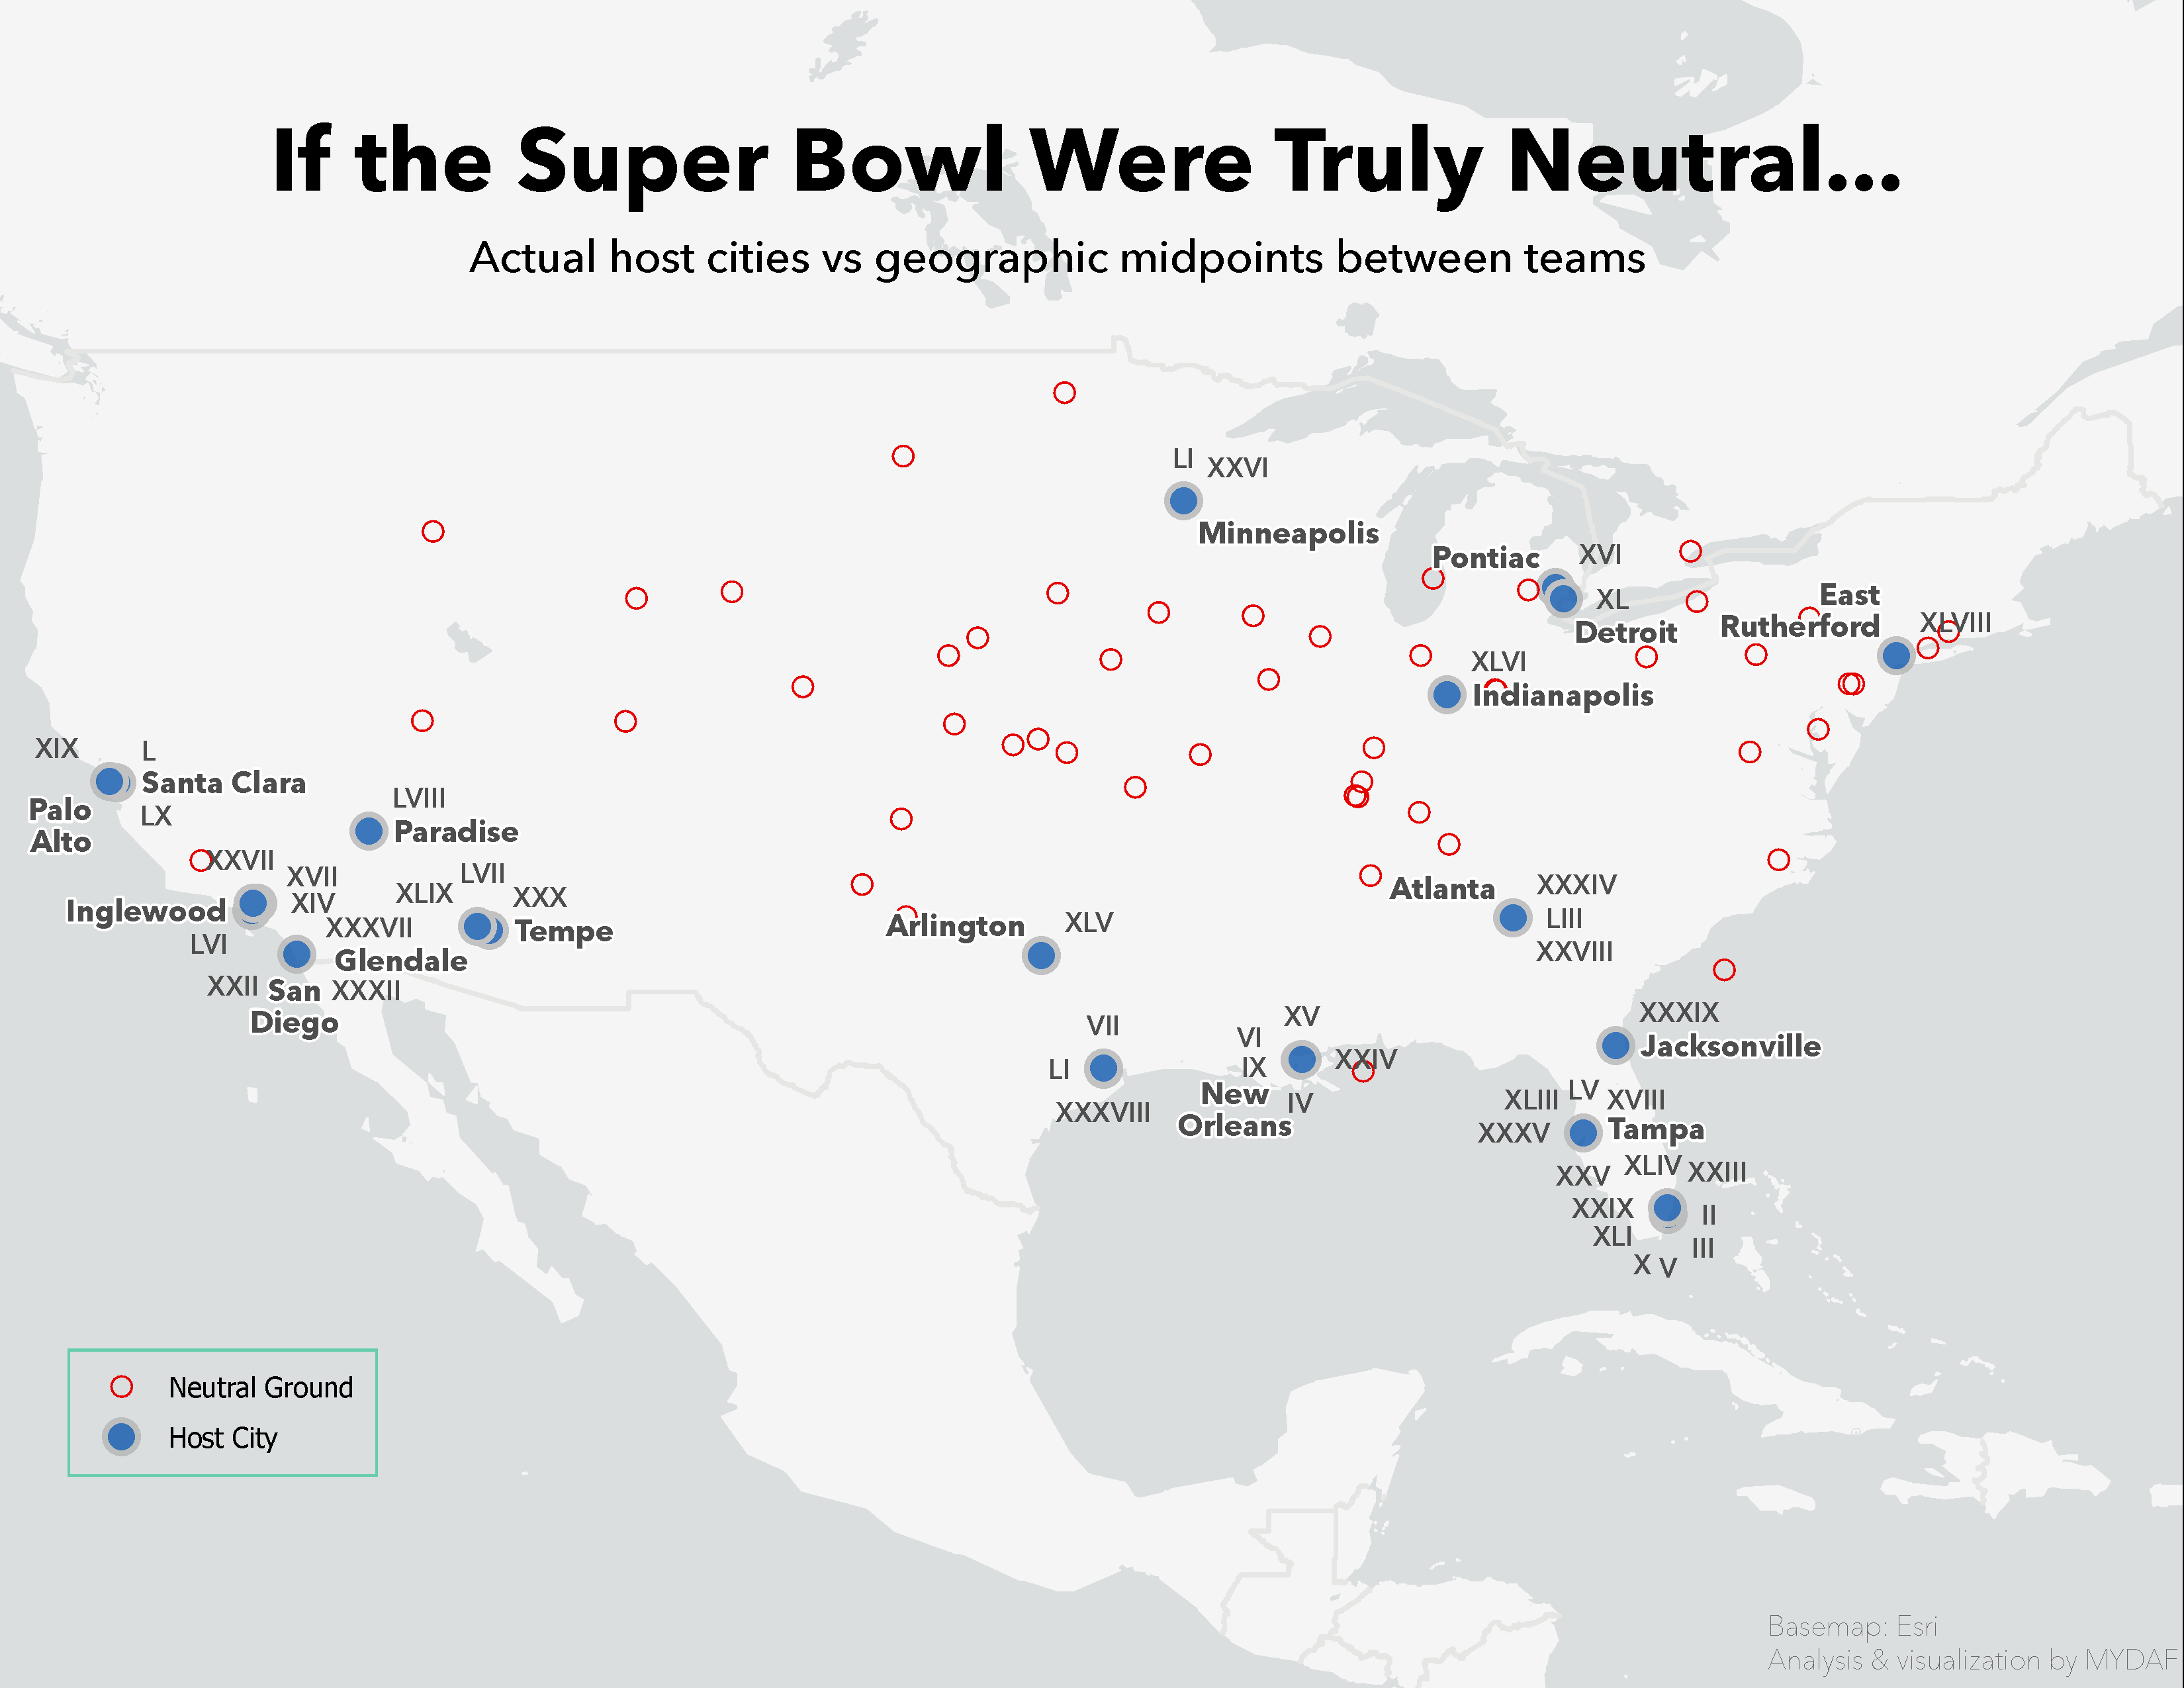
The Super Bowl is often described as being played on “neutral ground.”
Blue dots show the actual host cities for each Super Bowl.
Red dots show the geographic midpoint between the two teams playing in each game.
Midpoints are simple great-circle midpoints based on team home locations. No weighting, no travel assumptions, just geography.
by MapsYouDidntAskFor
14 Comments
**[OC]**
**Data sources:**
– Super Bowl matchups and host cities compiled from publicly available NFL historical records
– Team home city locations from publicly available geographic references
**Method:**
For each Super Bowl, I calculated the geographic midpoint between the two participating teams using their home city coordinates.
**Tools used:**
– ArcGIS Pro
– Excel
Basemap: Esri
Analysis & visualization by MYDAF
This would be a lot better if it actually… showed what each red dot was. Like Ok, the dot in Southern Virginia/Northern North Carolina, what Superbowl was that? I dunno, its just a random red dot.
Which super bowl should have been played in the Atlantic?
Shouldnt you name the red circles as well?
The stadium off the coast of North Carolina would be sweet. Maybe not in February though.
For the Super Bowl that should have been hosted at 48.5 degrees latitude, which two teams were that? No NFL team is north of Seattle, which is 47 ish degrees.
How in the world did a red circle end up in northern Minnesota
Is the repeated choices of California and Florida purley based on weather?
OP, do you think you could reupload with state borders imposed on the map? It’s a little difficult to tell exactly where these midpoints fall. Otherwise, it’s a great research premise!
If you have enough money to spend on tickets to the game then you have enough for a plane ticket regardless how far away you live
Neutral ground does not imply same distance to stadium.
WTF is the Dr Evil Island in the middle of the Atlantic?
What are we weighting for?
https://preview.redd.it/18zy1xuawbig1.png?width=3300&format=png&auto=webp&s=35f30ba963071087b071ec39c9e60ba9e227c2bd
**Update:** I realized it was hard to tell where the neutral points came from so I added faint lines between SB opponents and state borders for orientation.
Red dots are still the geographic midpoint between the two teams in that Super Bowl, blue dots are the actual host cities.