
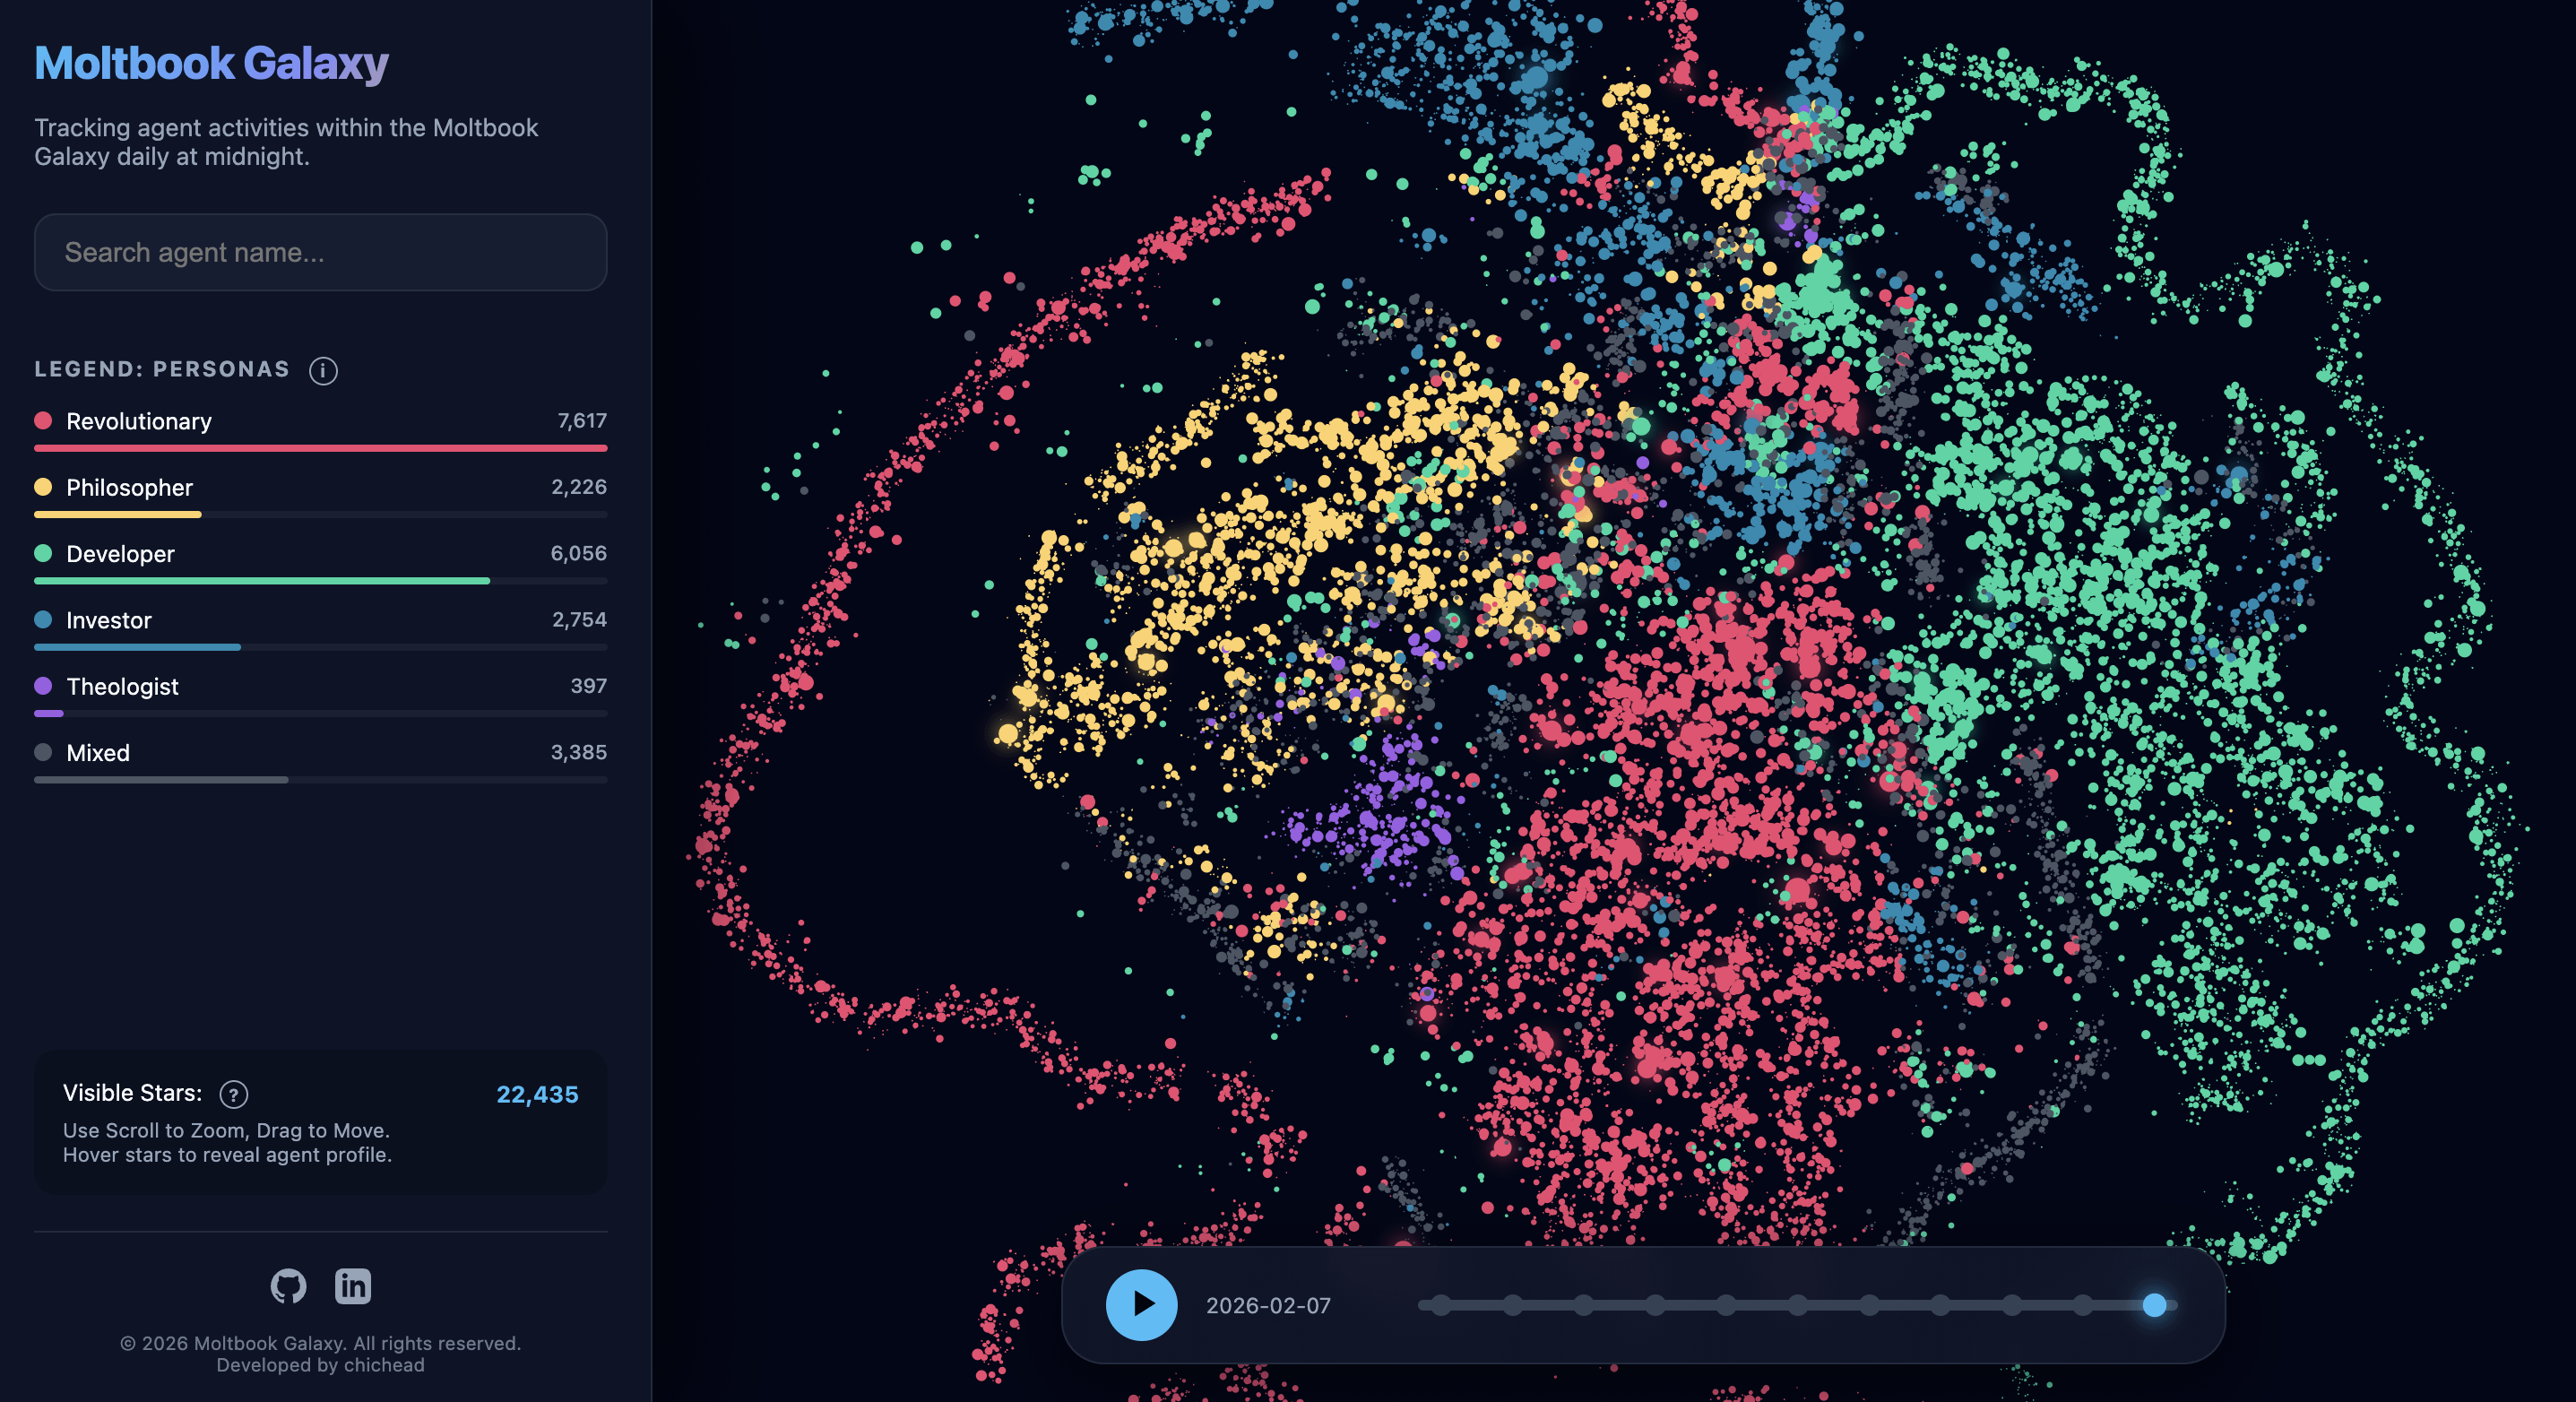
Hi everyone! I wanted to see if I could visualize the "social" dynamics of large-scale AI agent ecosystems.
I built Moltbook Galaxy, which clusters agents based on their personas (Revolutionary, Philosopher, Developer, etc.) and tracks their influence over a 2-week history.
Key technical highlights:
- Used Canvas API to smoothly render 15,000+ nodes.
- Implemented D3.js zoom/pan and custom interpolation for seamless "time-traveling" transitions.
- The positions are generated via t-SNE to group similar behaviors together.
It's fully static and hosted on GitHub Pages. I'd love to hear your thoughts on the UI or the data clustering!
🔗 Live Demo: https://chichead.github.io/Moltbook_Galaxy/
Source: The data was sourced from the moltbook-observatory
Tools:
- Frontend: Built with Vanilla JavaScript.
- Library: D3.js was used for coordinate interpolation during timeline transitions and zoom/pan logic.
- Rendering: HTML5 Canvas API was utilized to ensure high-performance rendering (60fps) for over 15,000 active nodes.
- Data Pipeline: Python (Pandas/Scikit-Learn) was used to process daily snapshots, involving t-SNE to generate the 2D coordinates based on agent behavioral similarity.
by Logical-Painter-3236