
The bullish engulfing pattern shows up in every candlestick book as a reliable reversal signal. I wanted to see if context matters as much as people claim.
What I tested:
- Sample size: 1,047 bullish engulfing candles (green candle completely engulfs prior red candle)
- Markets: S&P 500 stocks, daily timeframe
- Period: 2020-2024
- Success metric: Price higher 5 days later (simple, no fancy r/R calculations)
- Context variables: Trend direction, support proximity, volume, prior decline magnitude
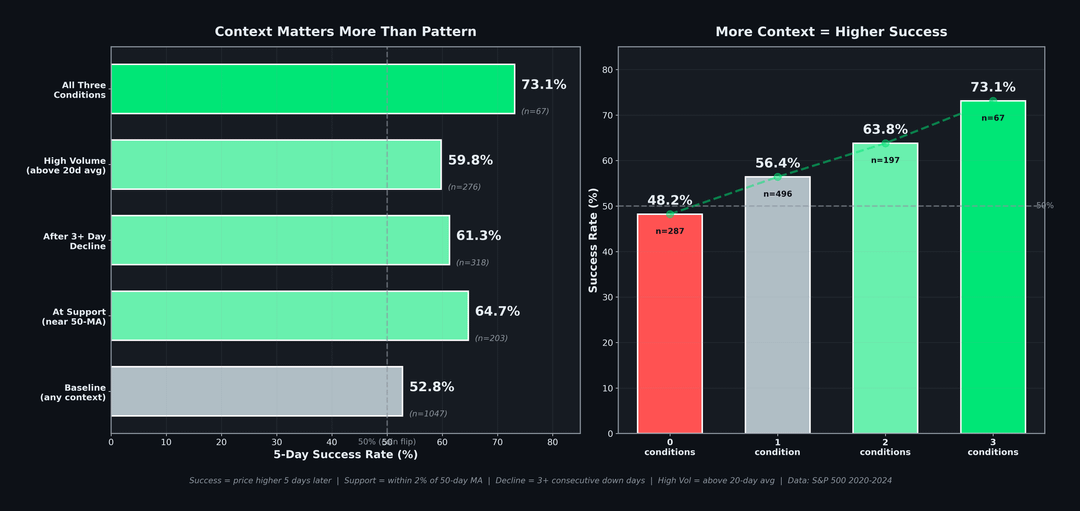
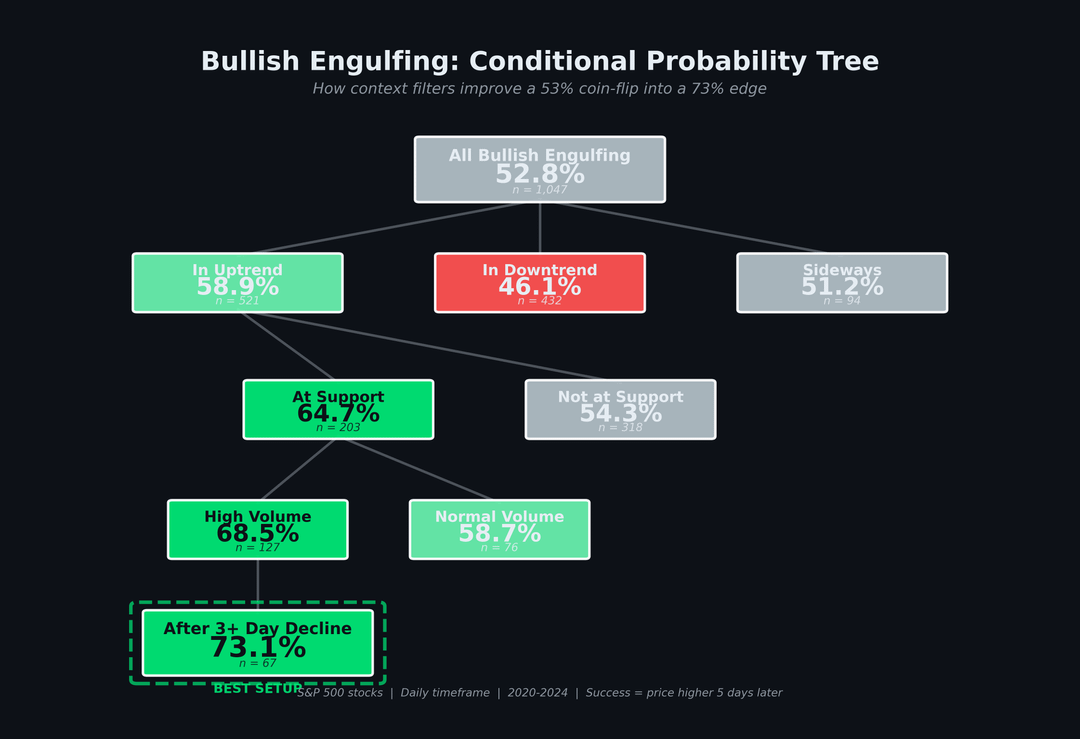
Overall results: Bullish engulfing patterns had a 52.8% success rate in isolation.
Barely better than a coin flip. But when I filtered by context, the picture changed completely.
Context-dependent success rates:
- At support level within 2% of 50-day MA : 64.7% success rate (n=203)
- After 3+ day decline: 61.3% success rate (n=318)
- With above-average volume: 59.8% success rate (n=276)
- All three conditions met: 73.1% success rate (n=67)
- In uptrend price > 200-day MA : 58.9% success rate (n=521)
Worst performers:
– In downtrend at resistance: 38.2% success rate (n=94)
– After single red day (no real decline): 47.1% success rate (n=412)
Key takeaway:
The pattern itself is weak. What matters is where it forms and what happened before it. A bullish engulfing at support after a multi-day
decline has real predictive value. The same pattern in the middle of nowhere is noise.
Limitations:
This assumes you can identify "support levels" objectively in real-time, which is harder than hindsight analysis. I used the 50-day MA as
a proxy, but traders use different support definitions. Also, 5-day success might not match your holding period.
The visualization shows conditional probabilities, which I think is more useful than just saying "this pattern works X% of the time."
The 73% win rate sounds great until you see n=67. Would you trust that sample size, or is this just noise dressed up as a finding?
by Sirellia
2 Comments
Data source: S&P 500 daily OHLCV data, 2020-2024 (via Yahoo Finance API)
Tools: Python (pandas, matplotlib) for analysis and visualization
Take any 3 day decline past 5 years and whats success for higher price after 5 days regardless of pattern