
Risk and Reward for Higher Education: Debt Burden for 75th Percentile Earners Vs 25th Percentile Earners for their own debt, and their parents at each 4-year institution.
I posted a chart a few weeks ago from my higher ed data project. Based upon the feedback I am sharing two other related charts.
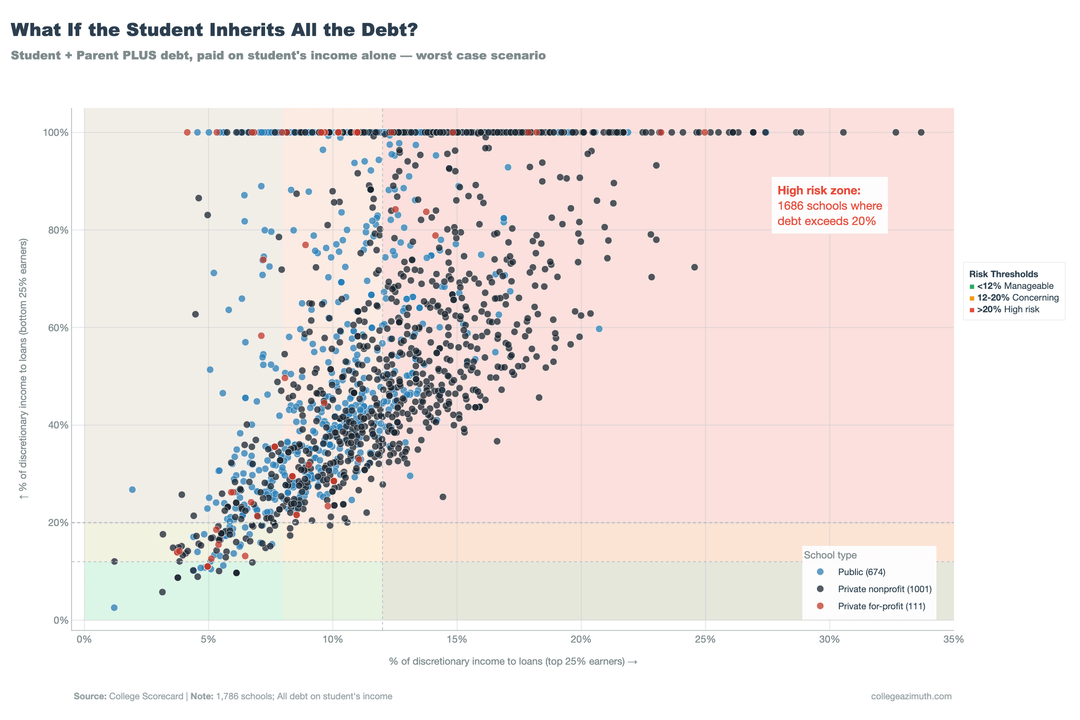
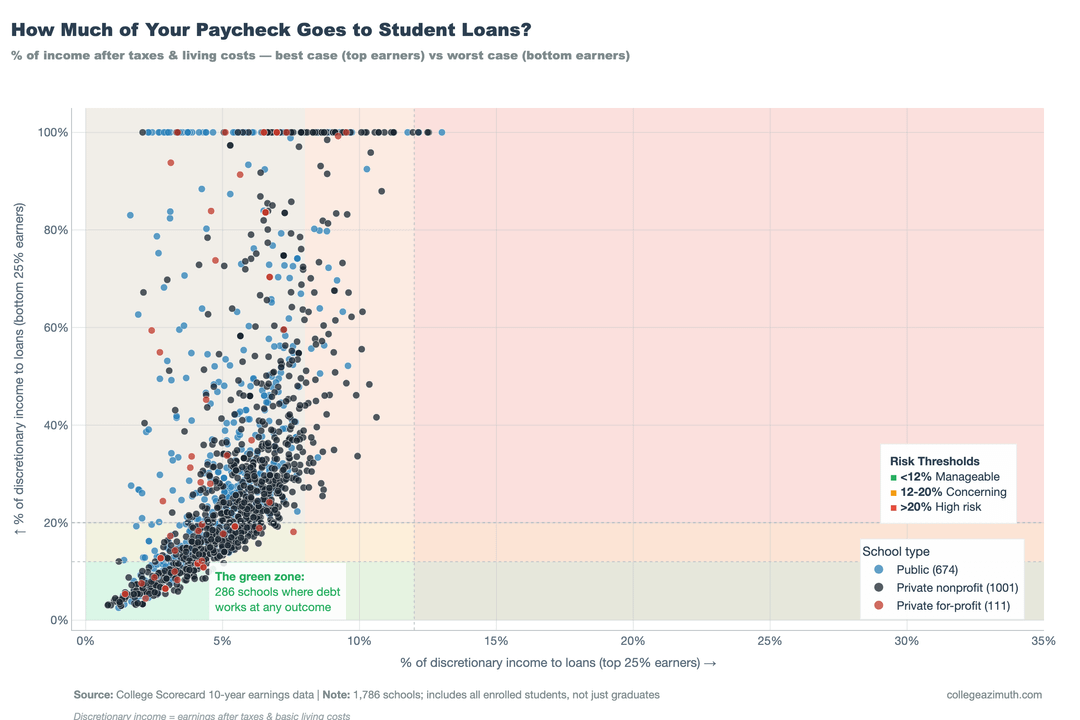
This maps out the Risk and Reward of Higher Education institutions. Each dot is the Student Debt burden for the 75th Earners versus the 25th Percentile Earners for each 4 year institution in the country. The intent is to show what the burden looks like if you make it each institution, versus what happens if you don't.
I look at this from two frames:
- Student Debt only – The Median Debt for students at each institution, and the P75, and P25 income for it.
- Student Debt + Parent Debt – This for the circumstances where a student is on their own, and/or their parent is only willing or able to co-sign and/or expects the student to cover the debt once they graduate.
I incorporated some of the feedback I got on the last check. This was done in Plotly, and there are interactive versions for the student version here, and the Student Cover the parent version here. So you can hover the plot points and see each institution’s specific numbers.
I also did extensive write-ups on how I think about both here:
Student Debt Burden Risk Framework.
My main take away being: Only a handful of schools work in both scenarios, and a lot of schools really really don't look good on the downside.
All raw data is from the US Department of Education College Scorecard. The computations for Debt Burden are mine (OC) using a framework I created which cribs heavily from how the U.S. Government calculates income based repayment for public loans.
The Data is constructed in python, and Plotly for the interactive versions.
by DanielAZ923
3 Comments
Sorry meant to put this in the comment:
This maps out the Risk and Reward of Higher Education institutions. Each dot is the Student Debt burden for the 75th Earners versus the 25th Percentile Earners for each 4 year institution in the country. The intent is to show what the burden looks like if you make it each institution, versus what happens if you don’t.
I look at this from two frames:
1. Student Debt only – The Median Debt for students at each institution, and the P75, and P25 income for it.
2. Student Debt + Parent Debt – This for the circumstances where a student is on their own, and/or their parent is only willing or able to co-sign and/or expects the student to cover the debt once they graduate.
I incorporated some of the feedback I got on the last check. This was done in Plotly, and there are interactive versions for the [student version here](https://collegeazimuth.com/charts/gps02/p25_vs_p75_scatter.html), and the [Student Cover the parent version here.](https://collegeazimuth.com/charts/gps02/p25_vs_p75_student_covers_all.html) So you can hover the plot points and see each institution’s specific numbers.
I also did extensive write-ups on how I think about both here:
[Student Debt Burden Risk Framework.](https://collegeazimuth.com/analysis/gps02-risk-framework/)
[Parent + Student Burden](https://collegeazimuth.com/analysis/ou-what-happens-when-parents-borrow-too/)
My main take away being: Only a handful of schools work in both scenarios, and a lot of schools really really don’t look good on the downside.
All raw data is from the US Department of Education College Scorecard. The computations for Debt Burden are mine (OC) using a framework I created which cribs heavily from how the U.S. Government calculates income based repayment for public loans.
The Data is constructed in python, and Plotly for the interactive versions.
While which institution you go to matters, what matters more is probably which program you attend and which degree you graduate with. Any signal you get at an institution level is necessarily biased based on the share of programs at that school.
Gonna need that Green Zone school list now please