
Demographia International Housing Affordability (2023 Edition)
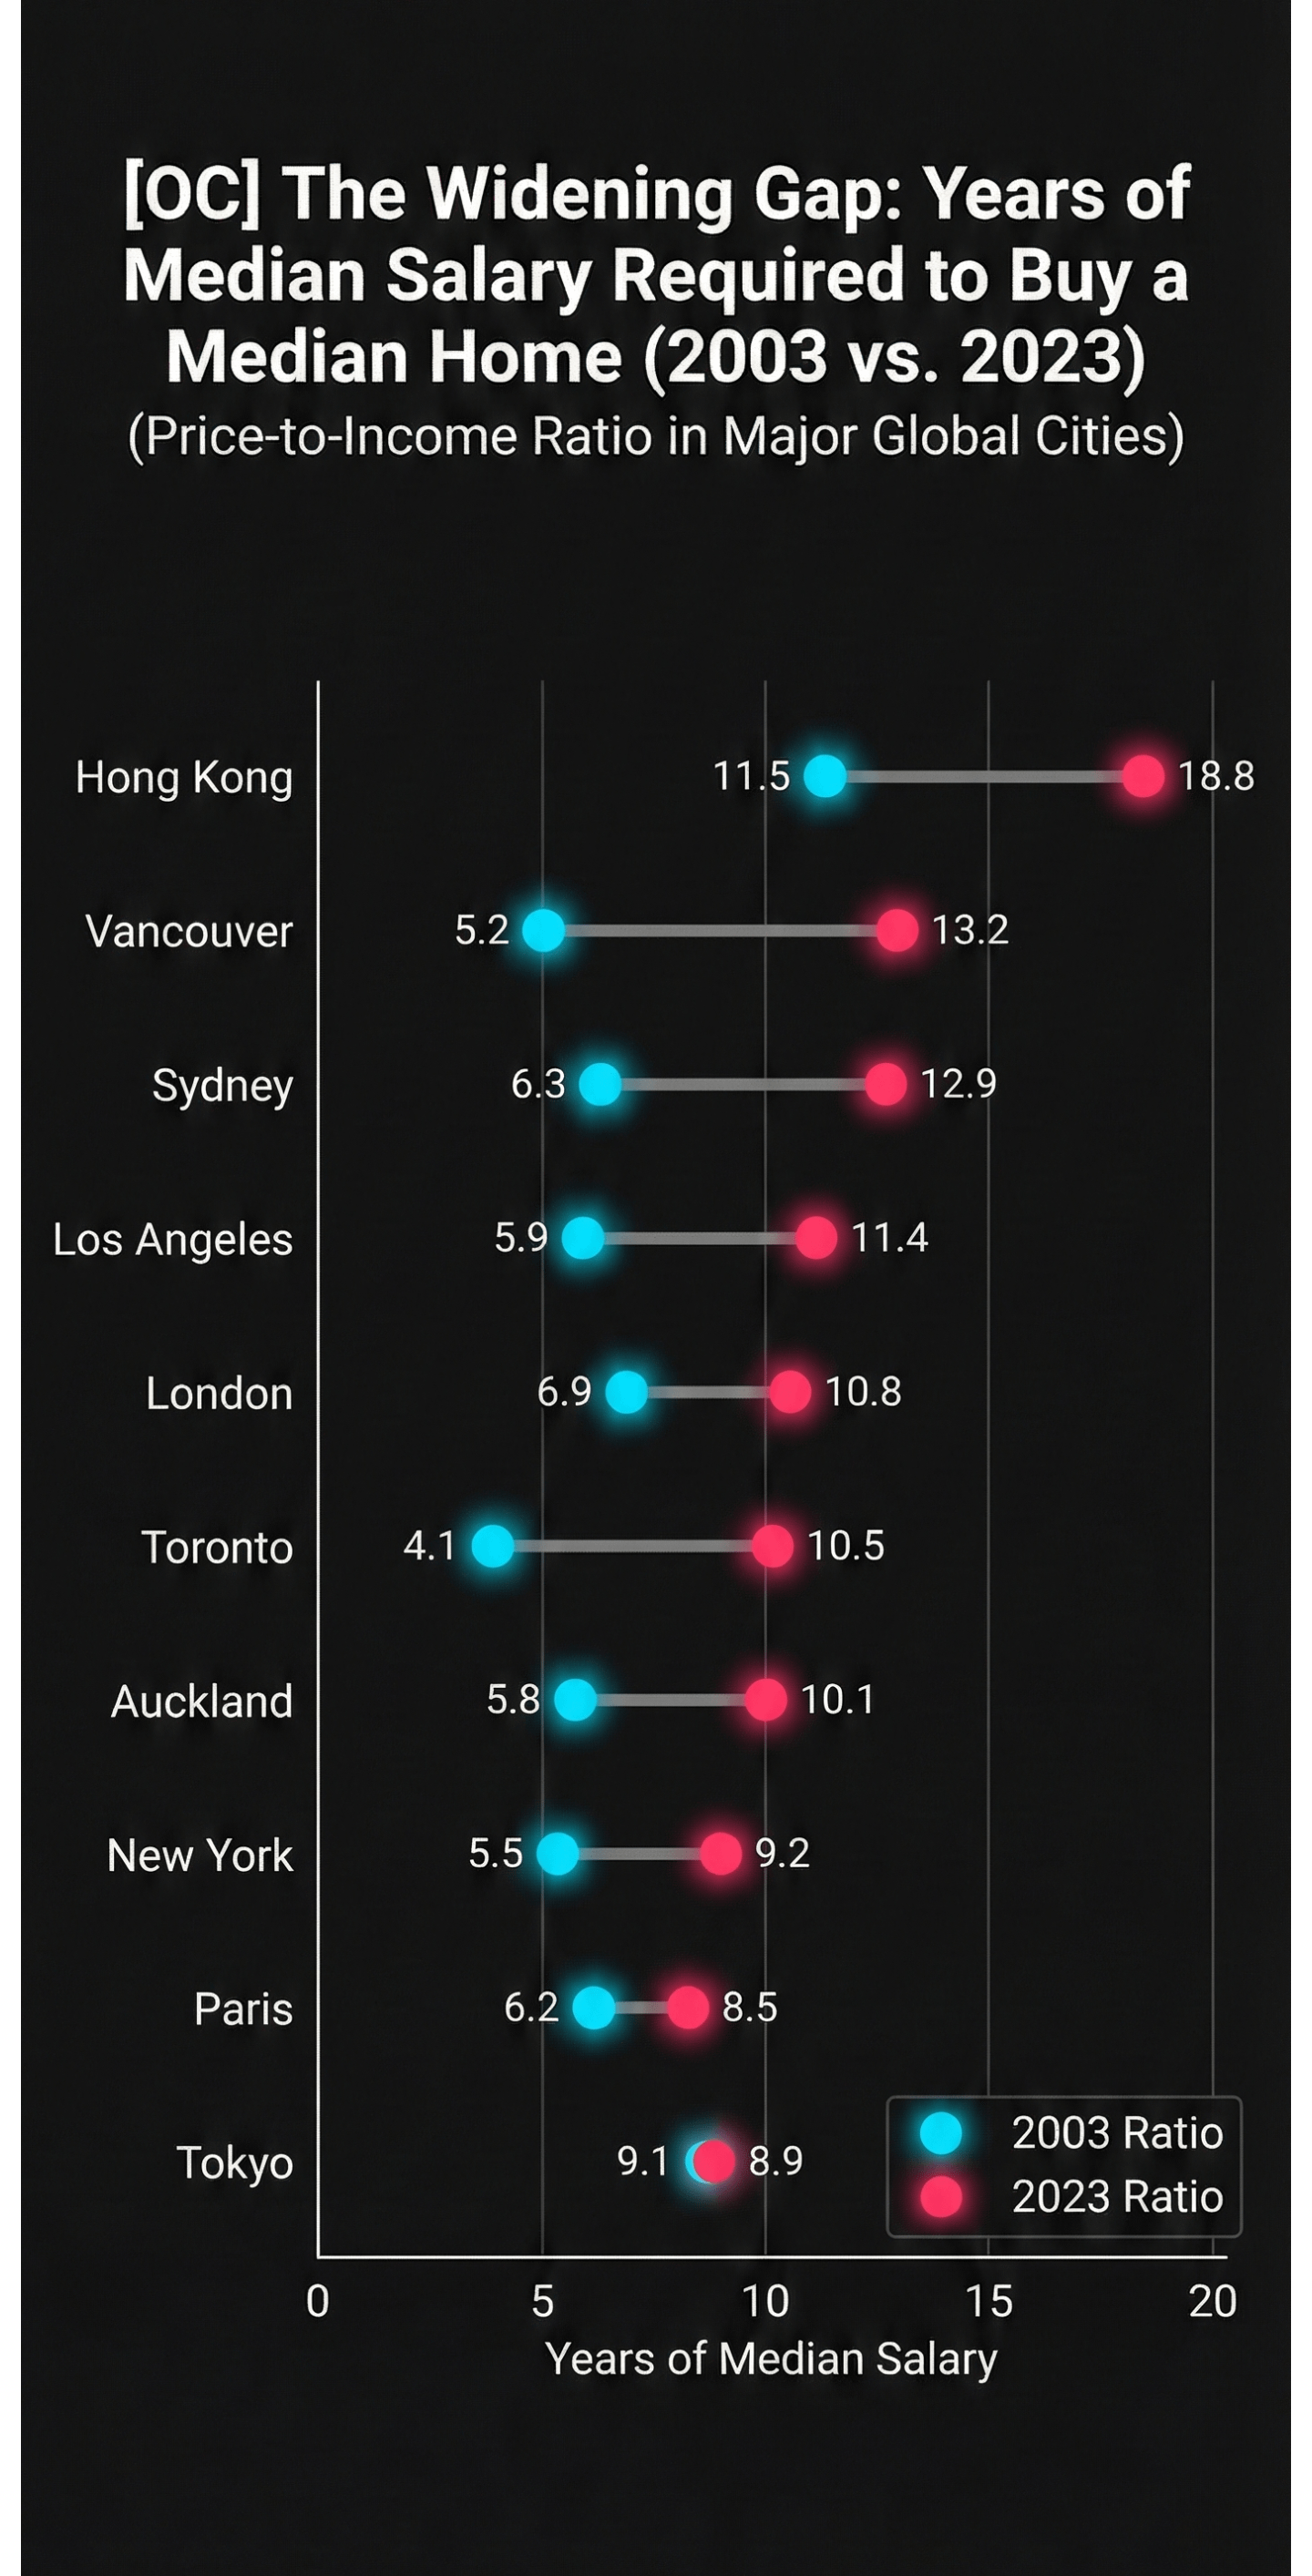
Contains the "2023" data points (e.g., Hong Kong at 18.8).
http://www.demographia.com/dhi2023.pdf
Demographia International Housing Affordability (2005-2006 Historical Data)
Contains the historical comparisons closest to the 2003 baseline.
http://www.demographia.com/dhi2006.pdf
Demographia Survey Archive (All Years)
Full repository of all annual reports since 2005.
http://www.demographia.com/dhi-ix.htm
by Ok-Lobster7773
4 Comments
Data:
Demographia International Housing Affordability (2023 Edition)
Contains the “2023” data points (e.g., Hong Kong at 18.8).
http://www.demographia.com/dhi2023.pdf
Demographia International Housing Affordability (2005-2006 Historical Data)
Contains the historical comparisons closest to the 2003 baseline.
http://www.demographia.com/dhi2006.pdf
Demographia Survey Archive (All Years)
Full repository of all annual reports since 2005.
http://www.demographia.com/dhi-ix.htm
Created with:
Created with code, then had Gemini create stylized visual from the raw output
Your first link is not working
https://preview.redd.it/1i42unkk3ugg1.jpeg?width=1080&format=pjpg&auto=webp&s=f8757cb790b5d4144f435157ffd7a318308187b8
I wanted to see if there’s data for Barcelona
Which one is larger in Tokyo? The numbers compared to the placement are confusing.
Shouldn’t Tokyo have the colours switched? As the data shows that in 2003 you needed a bit more than 2023, thus going the other way than other cities?