Source: I scraped data for 23,250 tokens on the Solana blockchain using the DexScreener API. To get a representative sample (not just the top 100 winners), I used a brute-force search method combined with popular keywords to find tokens across all market caps.
Tools:
* Python (Requests, Pandas) for data mining.
* Plotly (Python library) for the interactive WebGL scatter plot.
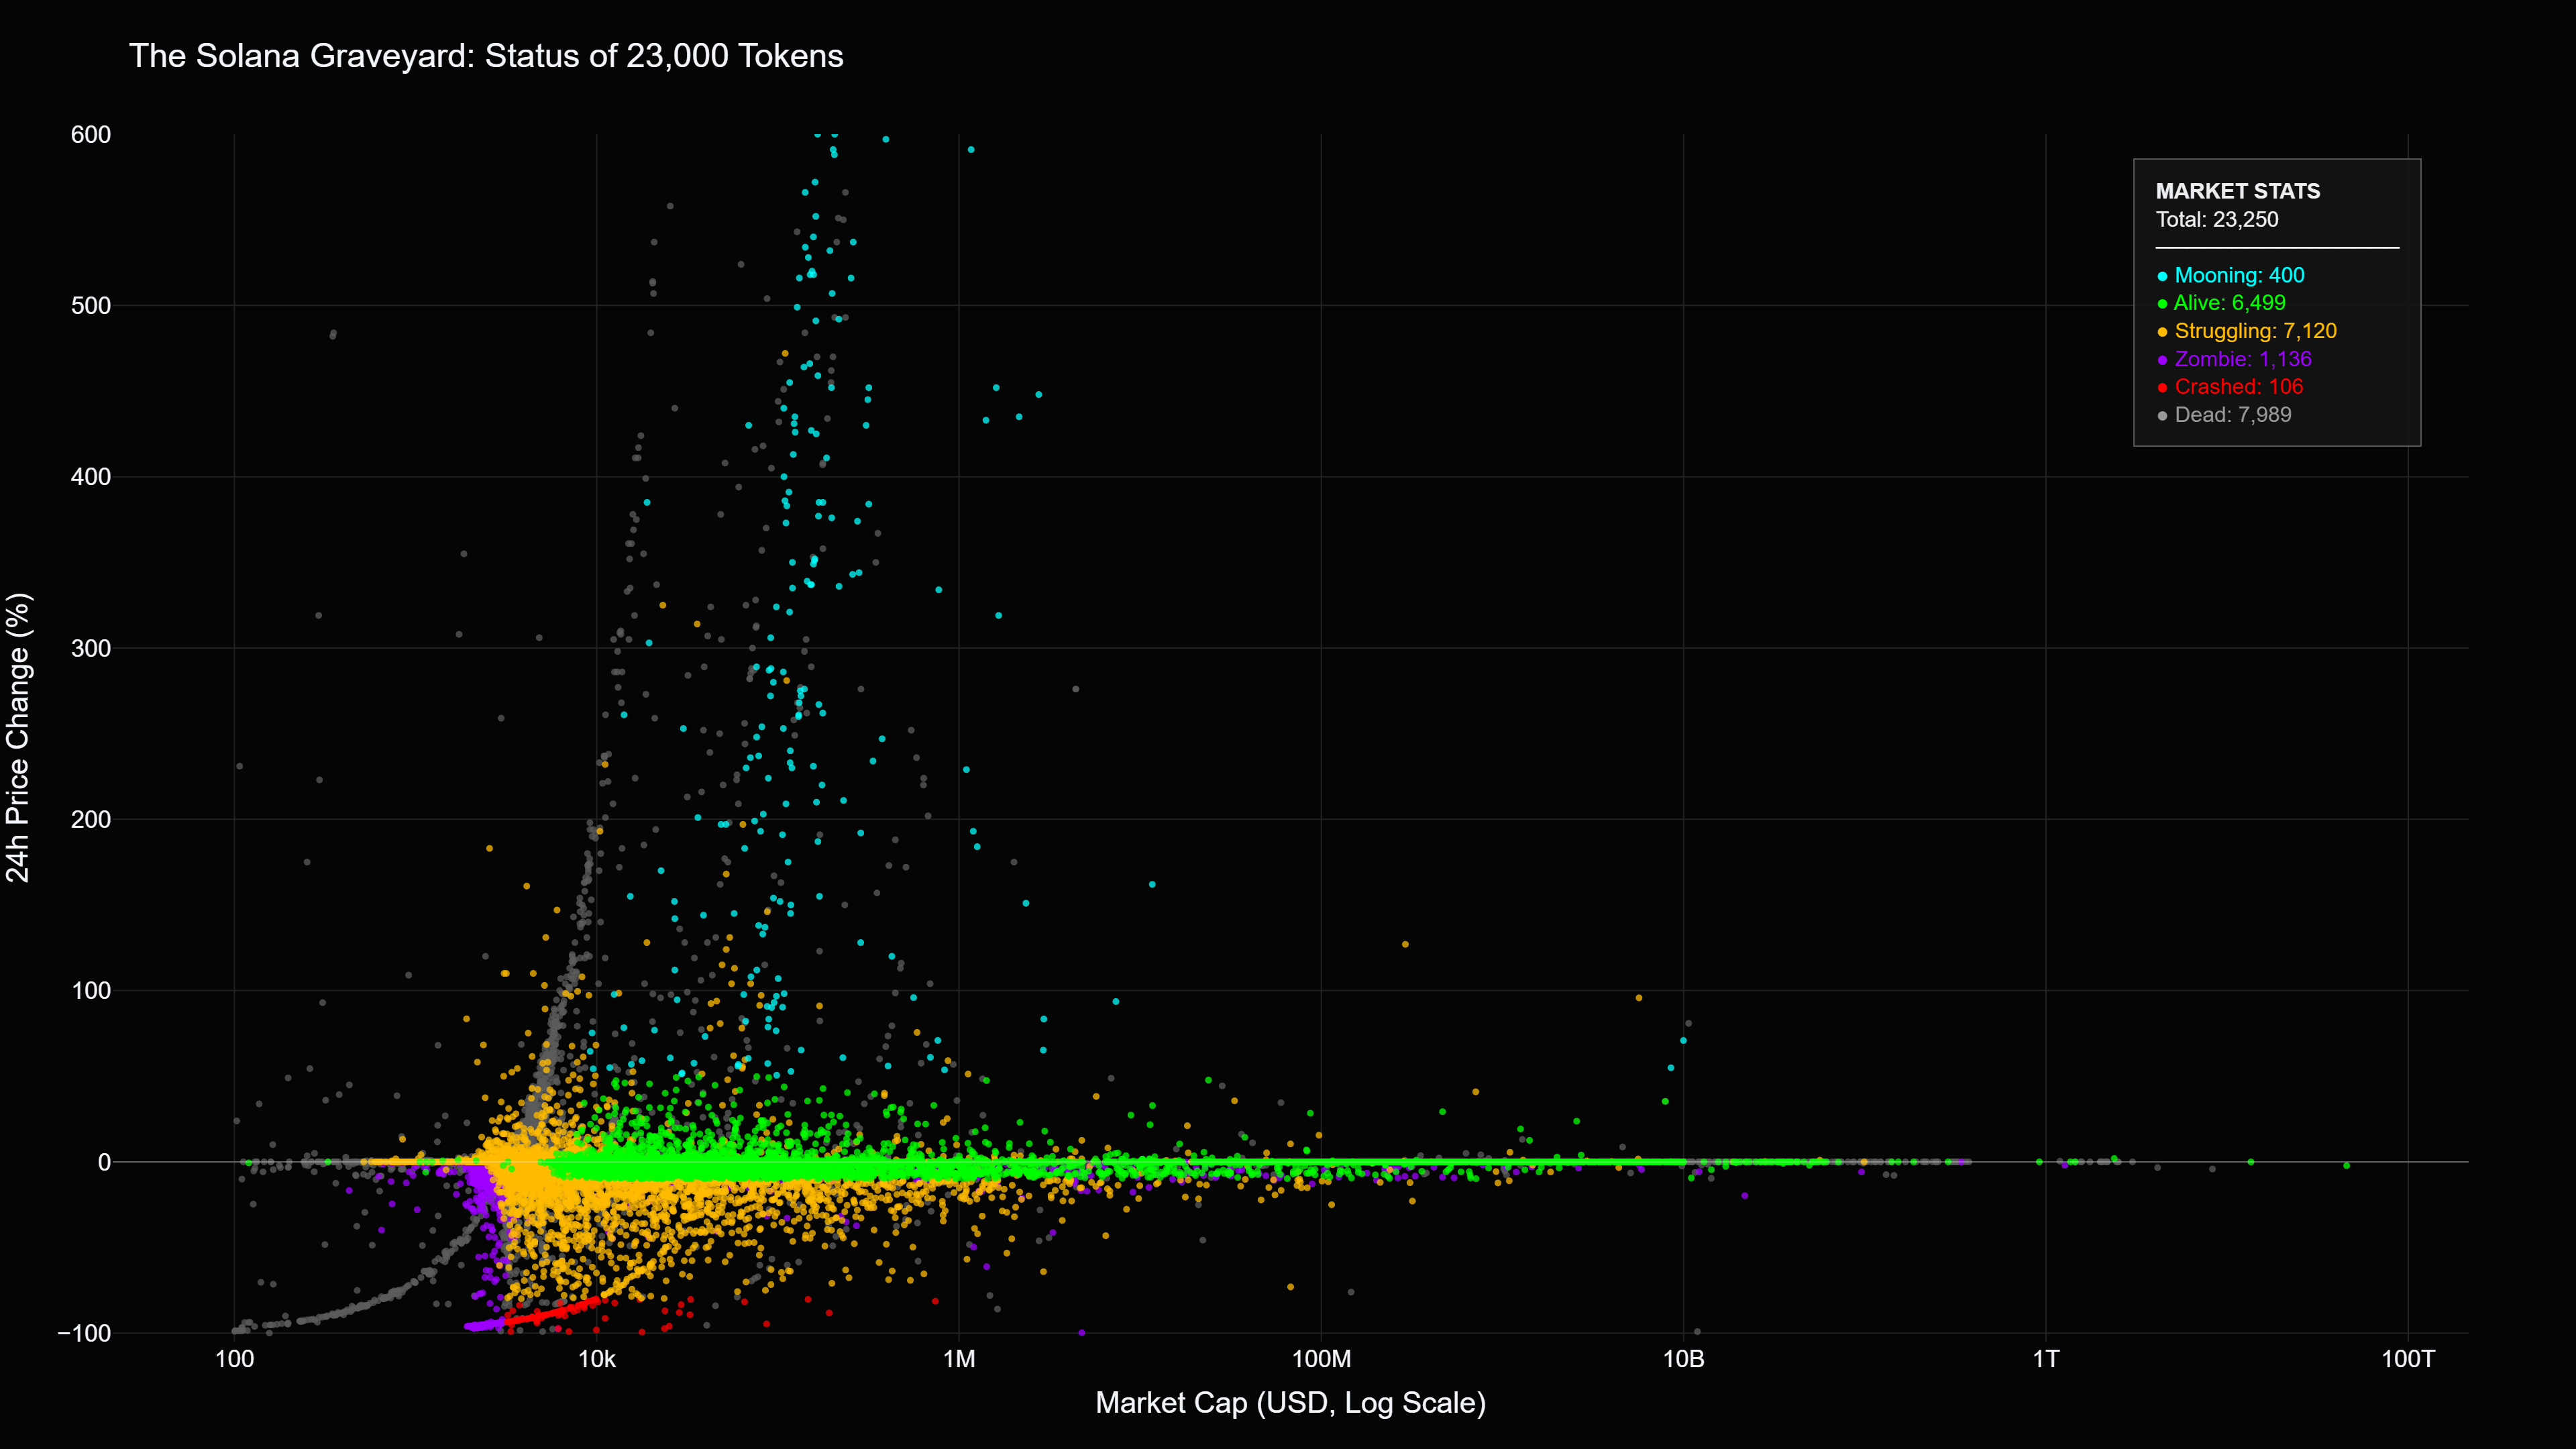
Methodology & Definitions: The graph uses a Logarithmic Scale for the X-axis (Market Cap) because the difference between a dead coin and a top coin is exponential.
* 💀 Dead / Rugged (Grey/Black): Defined as having Liquidity < $1,000. These are effectively abandoned or scammed projects.
* 🧟 Zombie (Purple): Liquidity $1k–$5k with negative price action. Not dead yet, but bleeding out without volume.
* 🩸 Crashed (Red): Tokens that lost >80% of their value in the last 24h.
* 🚀 Mooning (Cyan): Tokens with >50% growth in 24h and healthy liquidity.
* 🟢 Alive (Green): Stable tokens with >$10k liquidity.
Key Findings:
* Out of 23,250 analyzed tokens, ~40% fall into the “Dead/Rugged” or “Zombie” category.
* Only 1.7% met the criteria for “Mooning” (>50% gain + healthy liquidity).
* The vast majority (~30%) are in the “Struggling” zone (low volume, sideways price action).
No-Intention-5521 on
Wow this image looks really cool. Is like the best on i have ever seen. This really looks sooo good

2 Comments
Source: I scraped data for 23,250 tokens on the Solana blockchain using the DexScreener API. To get a representative sample (not just the top 100 winners), I used a brute-force search method combined with popular keywords to find tokens across all market caps.
Tools:
* Python (Requests, Pandas) for data mining.
* Plotly (Python library) for the interactive WebGL scatter plot.
Methodology & Definitions: The graph uses a Logarithmic Scale for the X-axis (Market Cap) because the difference between a dead coin and a top coin is exponential.
* 💀 Dead / Rugged (Grey/Black): Defined as having Liquidity < $1,000. These are effectively abandoned or scammed projects.
* 🧟 Zombie (Purple): Liquidity $1k–$5k with negative price action. Not dead yet, but bleeding out without volume.
* 🩸 Crashed (Red): Tokens that lost >80% of their value in the last 24h.
* 🚀 Mooning (Cyan): Tokens with >50% growth in 24h and healthy liquidity.
* 🟢 Alive (Green): Stable tokens with >$10k liquidity.
Key Findings:
* Out of 23,250 analyzed tokens, ~40% fall into the “Dead/Rugged” or “Zombie” category.
* Only 1.7% met the criteria for “Mooning” (>50% gain + healthy liquidity).
* The vast majority (~30%) are in the “Struggling” zone (low volume, sideways price action).
Wow this image looks really cool. Is like the best on i have ever seen. This really looks sooo good