
Hi! I made a visualization of every drive I did last year in Tableau. It was my first time using the software so it took a while but any suggestions?
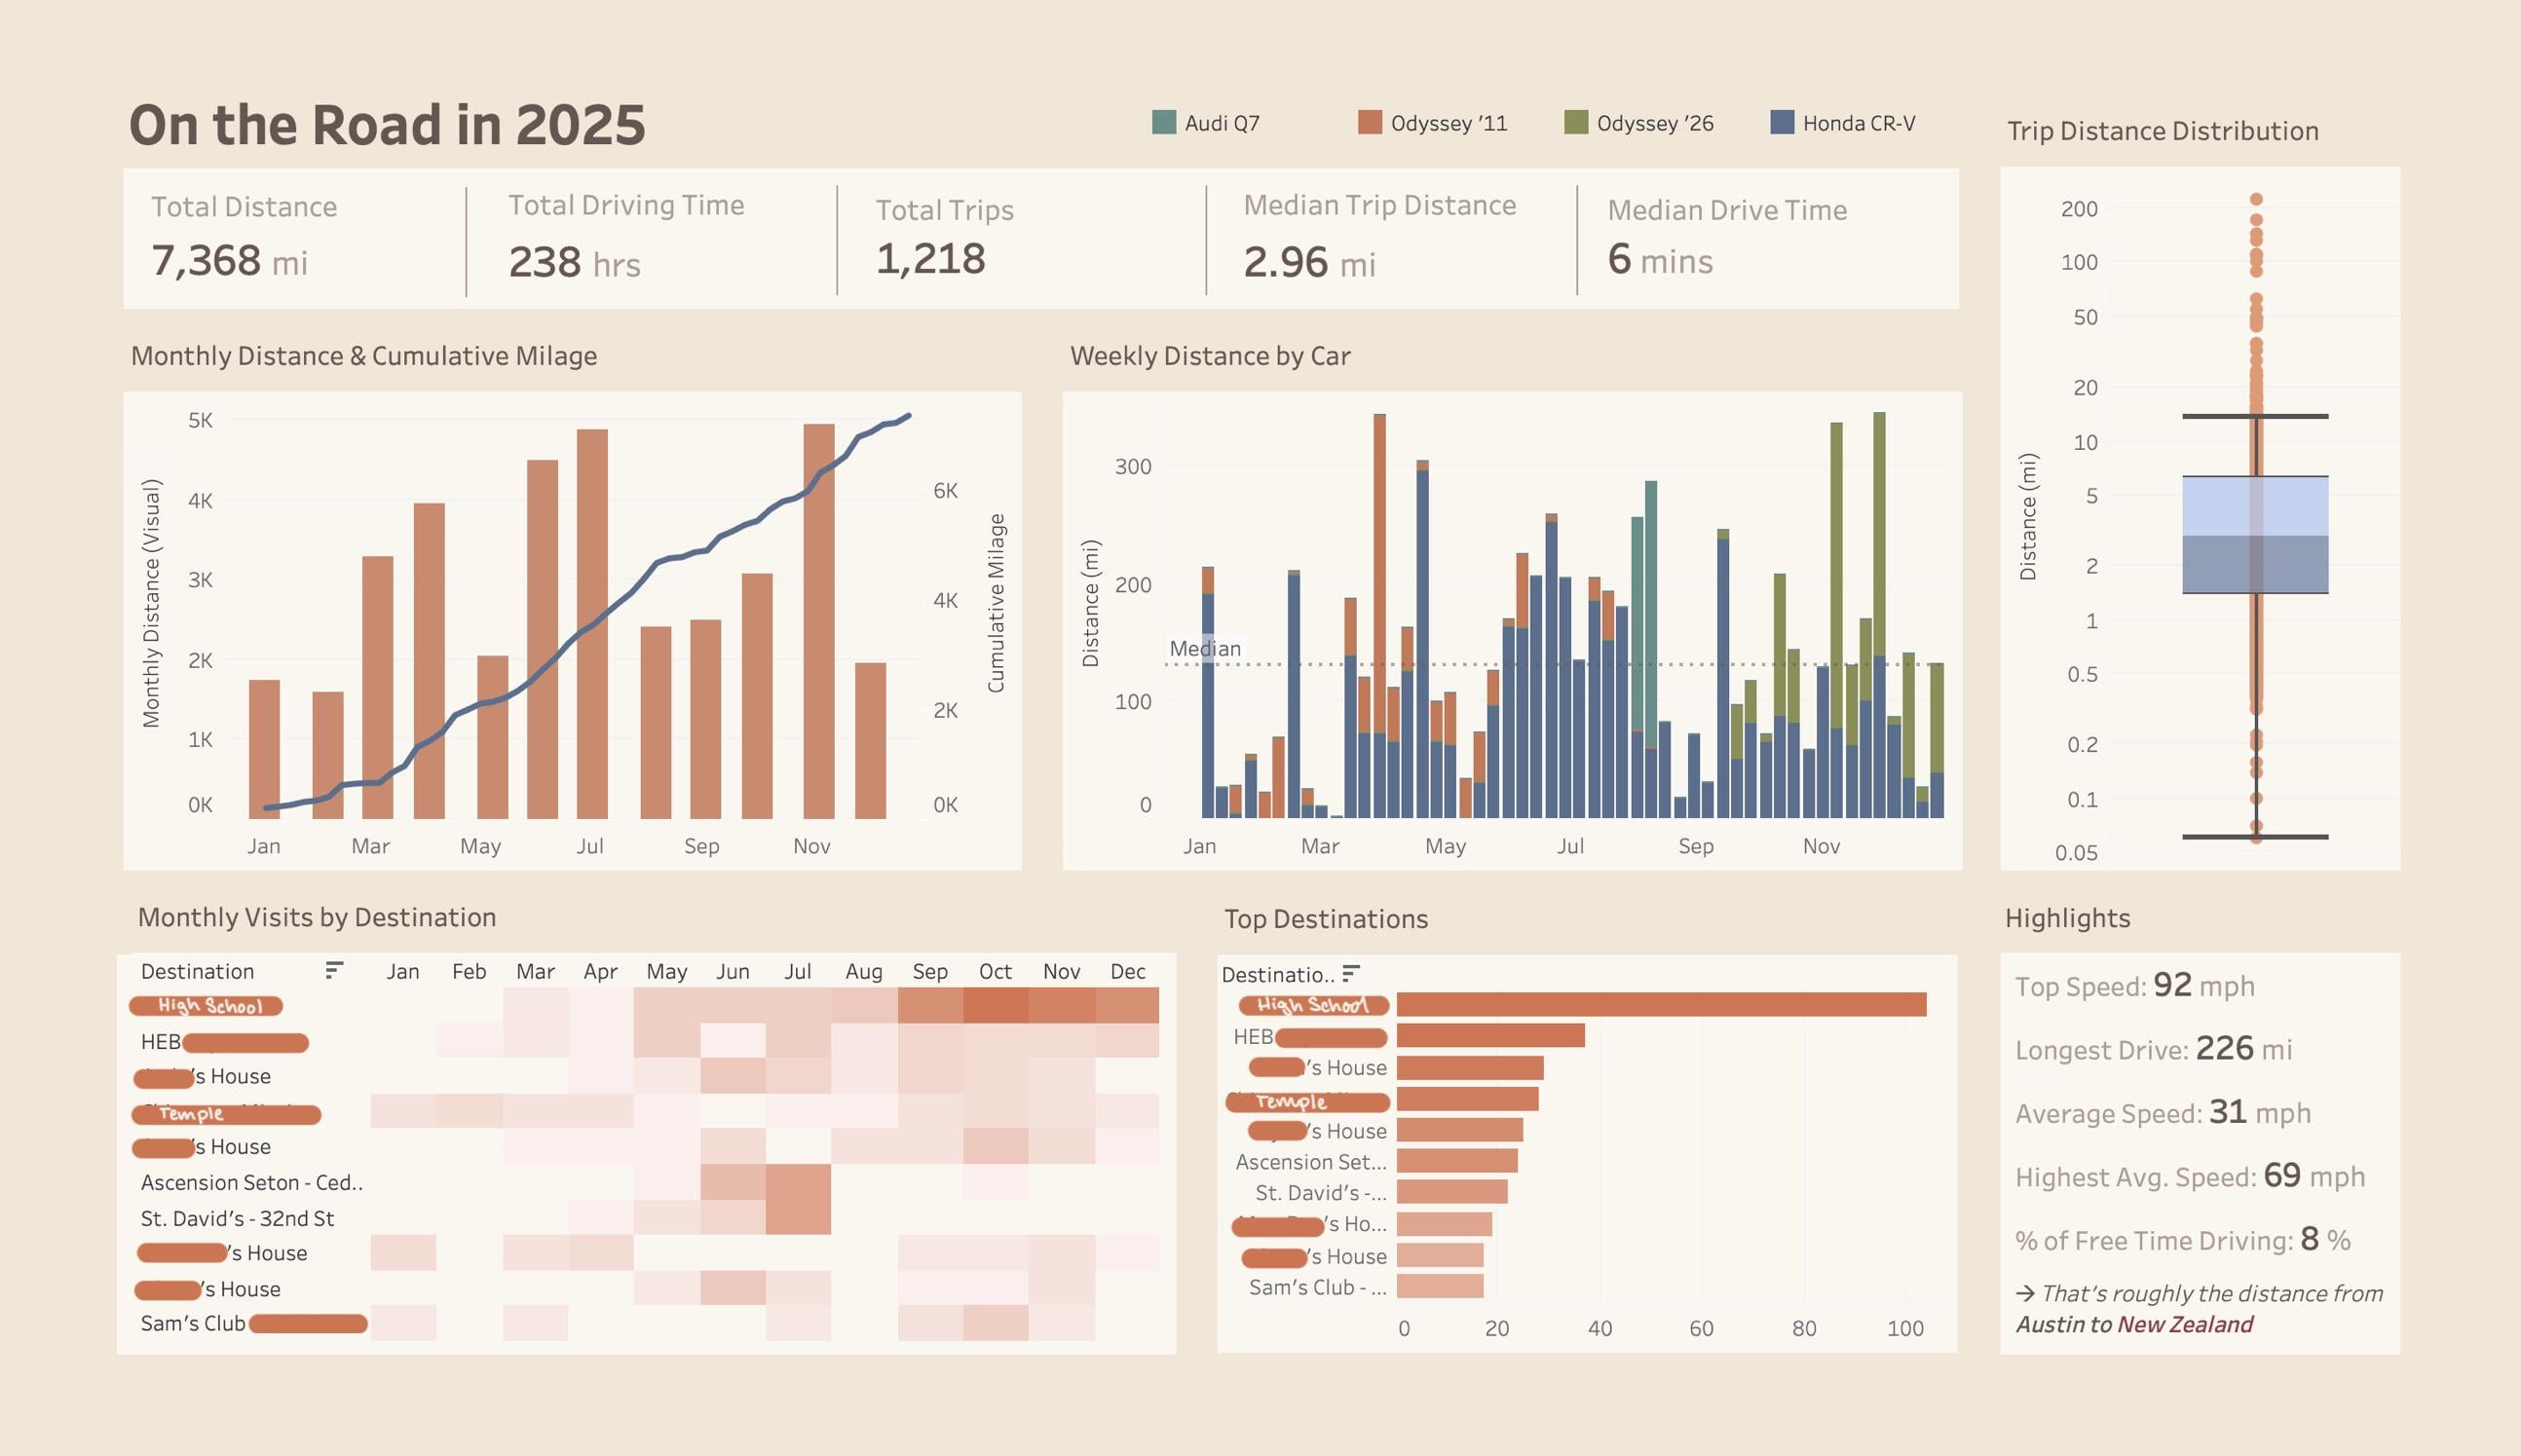
Also, I am aware of the problem with the monthly distance graph on the top left. Every number is multiplied by four, but everything else is good. I only noticed the error after I made the censored version so even though I fixed it on my end, I didn't want to re-censor everything.
For my non-Texans: HEB is a grocery store, Ascension Seton/St. David's are two hospitals I volunteered at, and Sam's Club is a wholesale retailer like Costco. All of the "___'s House" are various friends' houses.
Some key events:
- The spike in January is a road trip to a state park ~70 miles away
- The spike in late February is a college visit to Houston ~170 miles away
- The spike in late March is a college visit to College Station ~ 110 miles away
- The spike in mid April is driving to a hospital to shadow ~ 70 miles away twice
- The summer had a lot more driving because I drove downtown/far suburbs five days a week for internship/volunteering ~ 10-15 miles away (St. David's and Ascension Seton)
- The spike in early August in the Audi is a long road trip to New Mexico using a rental car
- The spike in September is picking up our new car in Houston ~ 170 miles away
- The spike in October is a road trip to a state park ~ 50 miles away
- The spike in early November is a college visit back to College Station ~ 110 miles away
- The spike in late November is a road trip to a state park ~ 100 miles away + just a lot of misc. driving around the city because of Thanksgiving break
- % of free time driving was calculated by dividing the number of hours I spent driving by the total number of hours that are not spent at school, sleeping, or in various other classes (things I cannot get out of)
I got my full license (that removes the restriction that requires a parent present in the car) in March. Before that, I only had a permit (that requires a parent to be in the car while you drive). My average weekly distance was 78 miles before, and 158 miles after.
For 2026, I am going to track each drive individually (as opposed to tracking each week as an aggregate as I did in 2025) to get more precise data, and also will track who was with me in the car, what I was listening to, and the source as well as the destination.
by Practical-Pumpkin-19
1 Comment
Tool: Tableau
Source: Drivey to track the drives and after I got home I inputted everything onto a giant google spreadsheet