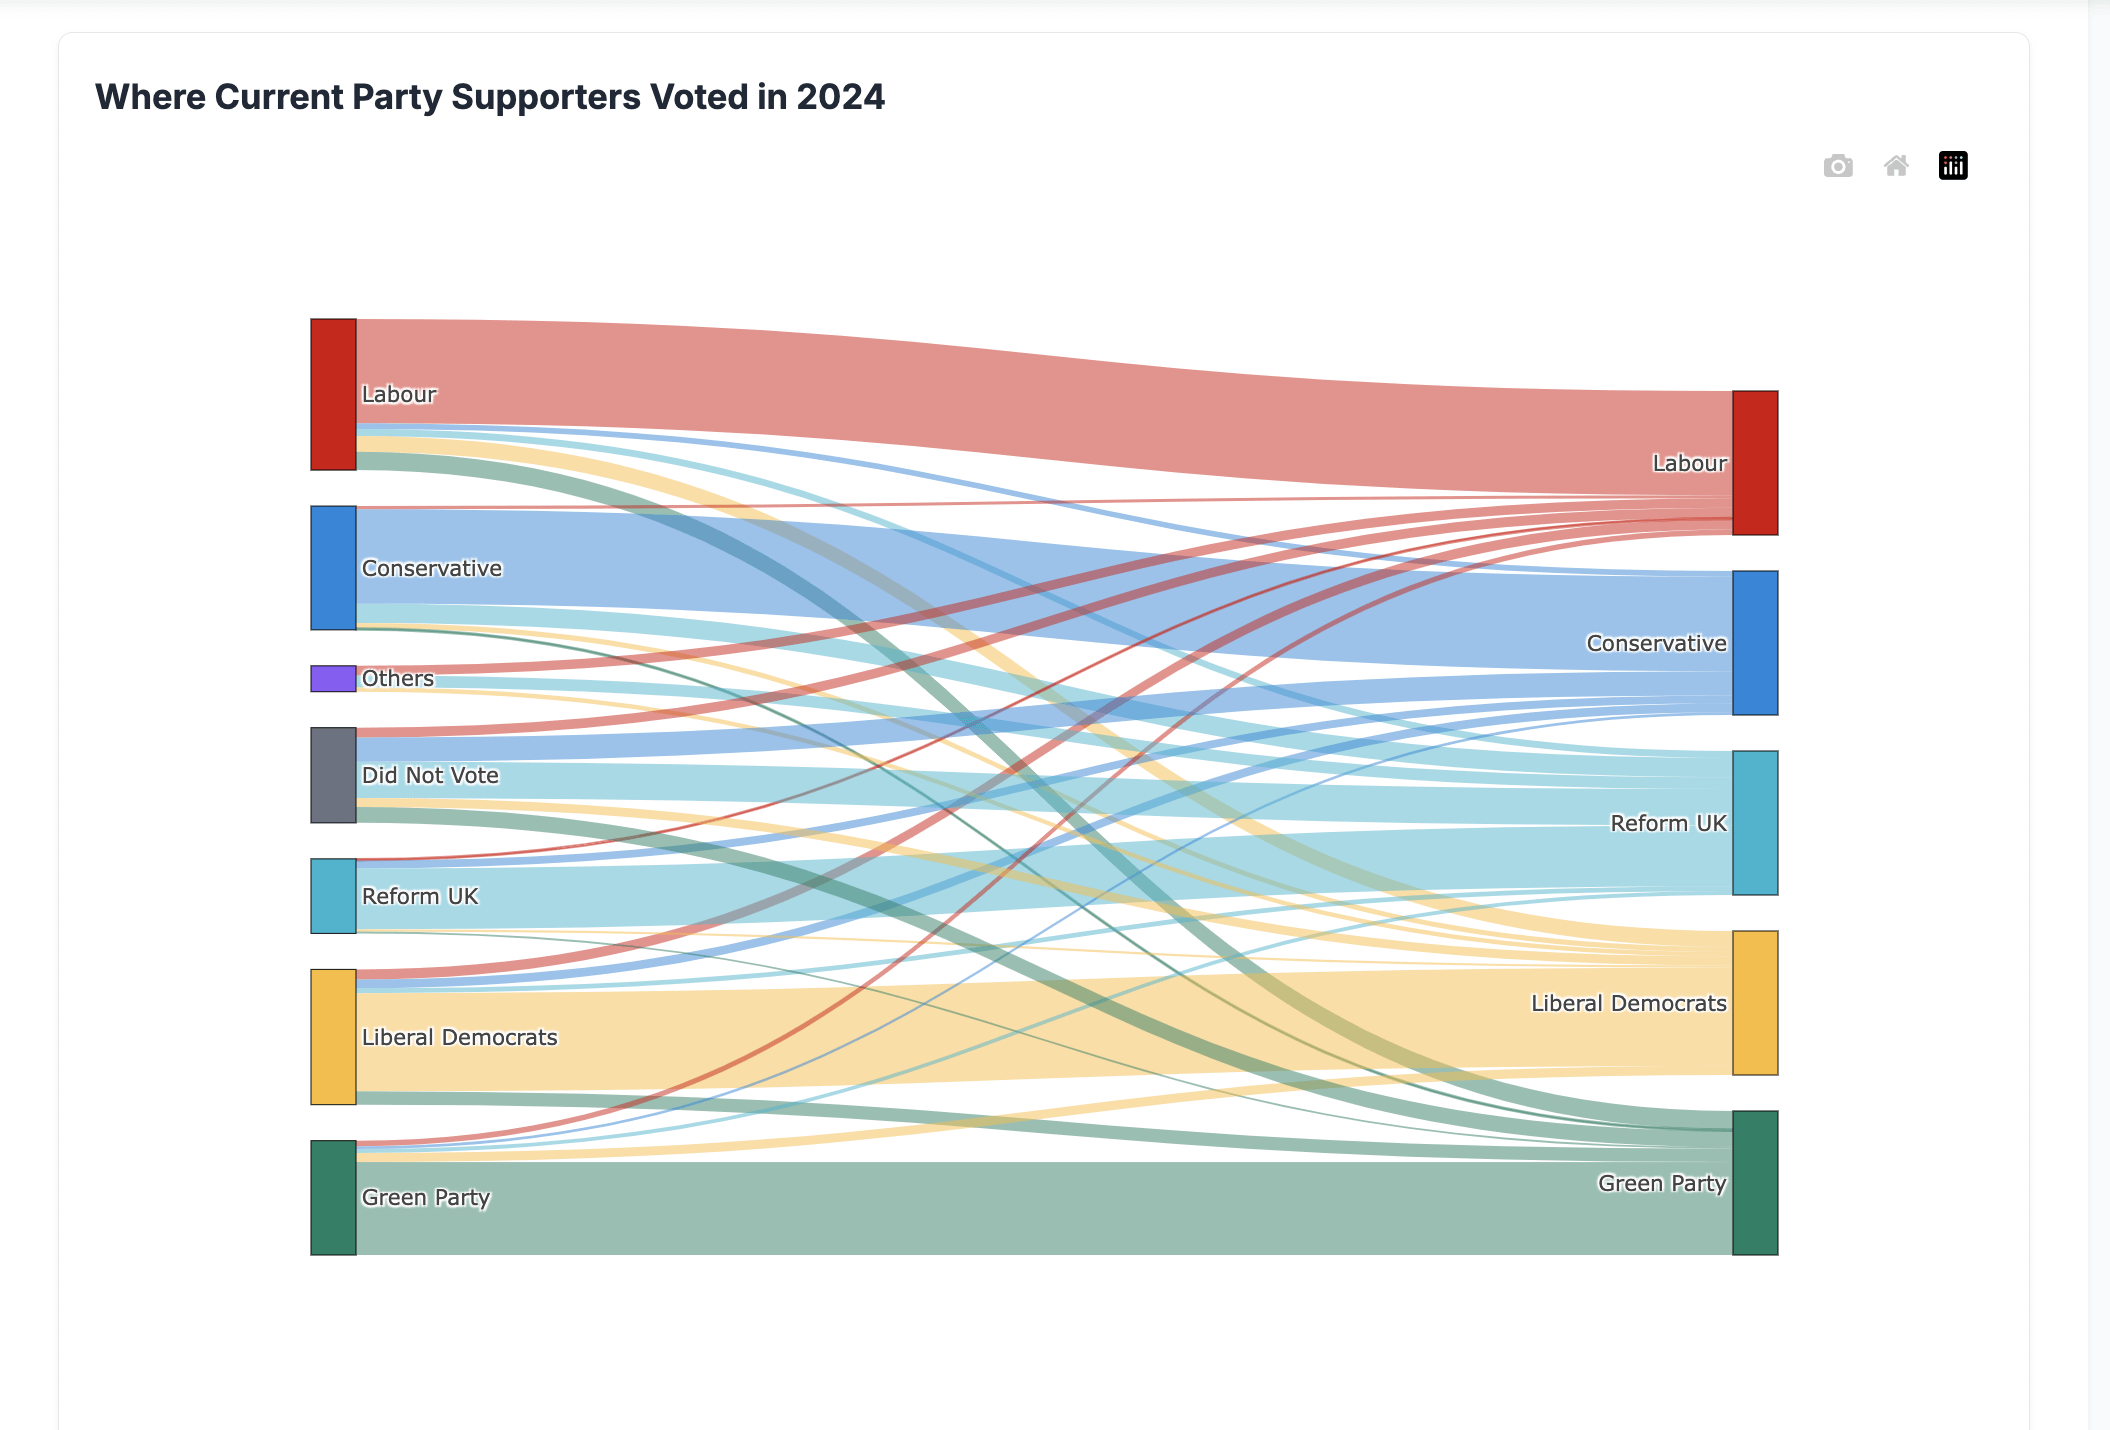
I created this Sankey Diagram showing how UK party support changed from the 2024 GE to today
**Methodology and Data:**
Various pollsters (YouGov, Find Out Now, Opinium, Freshwater Strategy, Survation, Verian) track party switching as part of their regular polling
These figures are usually sub samples within the crosstabs – as such they are not weighted and have small sizes. The diagram and figures are not definitive, but intended to be indicative, showing trends over time
I extract the party switch numbers, weight them by raw sample size, and normalise. I use a 7 poll moving average to arrive at the numbers currently shown in the diagram as the most recent point
**Tools:**
Plotly for Sankey Diagram, JS for hover tooltips and responsiveness
**Key Findings:**
The ‘insurgent’ parties, Reform and the Greens, have the large proportions of those who did not vote in 2024 – Reform 25% and Greens 11%
The Greens are the largest benefactor from Labour – gaining almost 13% of their 2024 vote
Reform has gained 13% of the 2024 Conservative vote
The Lib Dems are the second largest taker of Labour votes, with 11% of their 2024 vote
Hmm, a large chunk of Reforms support coming from non-voters does put their poll numbers in some perspective
GOT_Wyvern on
“Did Not Vote” is going to be the major place where votes are won in 2029, and it also happens to be by far the most fickle.
handtoglandwombat on
I’m surprised by the mild conservative comeback.
npeggsy on
People I’d love to speak to – Lab voters who are planning to go Con, Con voters going Lab, Green voters going Reform, Reform voters going Green. I know it’s only low numbers, but that has to be an interesting discussion.
celaconacr on
This is cool.
I would like to see a version that scales the Sankey end point to their expected vote proportion.
Also when you go to demographics 2024 the bar chart indicates for example 72% of Current Labour voters also voted for Labour in 2024. Yet the party retention chart has it at 53%. Am I misunderstanding these thinking they should be the same?
lordnacho666 on
Shouldn’t there be a “won’t vote next time” or “don’t know who I’m voting for yet” category?
Also, are the heights in proportion?
its_aom on
It’s sad that only populist extremists can effectively rescue voters from abstentionism, and even sadder that no one is doing an effective autocriticism about it

8 Comments
I created this Sankey Diagram showing how UK party support changed from the 2024 GE to today
**Methodology and Data:**
Various pollsters (YouGov, Find Out Now, Opinium, Freshwater Strategy, Survation, Verian) track party switching as part of their regular polling
These figures are usually sub samples within the crosstabs – as such they are not weighted and have small sizes. The diagram and figures are not definitive, but intended to be indicative, showing trends over time
I extract the party switch numbers, weight them by raw sample size, and normalise. I use a 7 poll moving average to arrive at the numbers currently shown in the diagram as the most recent point
**Tools:**
Plotly for Sankey Diagram, JS for hover tooltips and responsiveness
**Key Findings:**
The ‘insurgent’ parties, Reform and the Greens, have the large proportions of those who did not vote in 2024 – Reform 25% and Greens 11%
The Greens are the largest benefactor from Labour – gaining almost 13% of their 2024 vote
Reform has gained 13% of the 2024 Conservative vote
The Lib Dems are the second largest taker of Labour votes, with 11% of their 2024 vote
**Party Retention:**
Reform have kept 91% of their 2024 vote
Greens 83%
Lid Dems 68%
Conservatives 63%
Labour 53%
Full interactive version at [https://www.pollcheck.co.uk/path-to-no10](https://www.pollcheck.co.uk/path-to-no10) (Demographics tab > 2024 vote)
Hmm, a large chunk of Reforms support coming from non-voters does put their poll numbers in some perspective
“Did Not Vote” is going to be the major place where votes are won in 2029, and it also happens to be by far the most fickle.
I’m surprised by the mild conservative comeback.
People I’d love to speak to – Lab voters who are planning to go Con, Con voters going Lab, Green voters going Reform, Reform voters going Green. I know it’s only low numbers, but that has to be an interesting discussion.
This is cool.
I would like to see a version that scales the Sankey end point to their expected vote proportion.
Also when you go to demographics 2024 the bar chart indicates for example 72% of Current Labour voters also voted for Labour in 2024. Yet the party retention chart has it at 53%. Am I misunderstanding these thinking they should be the same?
Shouldn’t there be a “won’t vote next time” or “don’t know who I’m voting for yet” category?
Also, are the heights in proportion?
It’s sad that only populist extremists can effectively rescue voters from abstentionism, and even sadder that no one is doing an effective autocriticism about it