
This visualization is based on my personal running data.
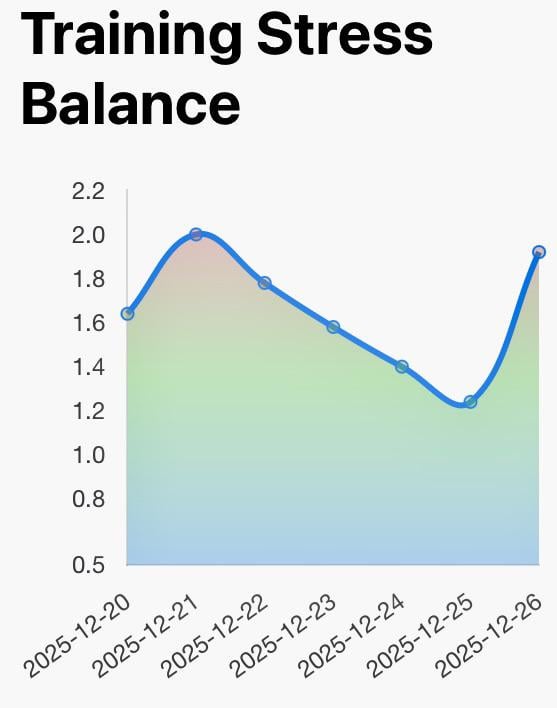
ATL is calculated as a 7-day exponentially weighted moving average of training load, while CTL uses a 42-day window.
I plotted the ATL/CTL ratio to explore how sudden changes in training load relate to perceived fatigue over time.
Curious to hear if others here track similar metrics or interpret this differently.
by alberteinstein35
1 Comment
The graph is based on my personal running data retrieved from Strava and displayed through my own scripts.