
Same procedure as every year? 🎁
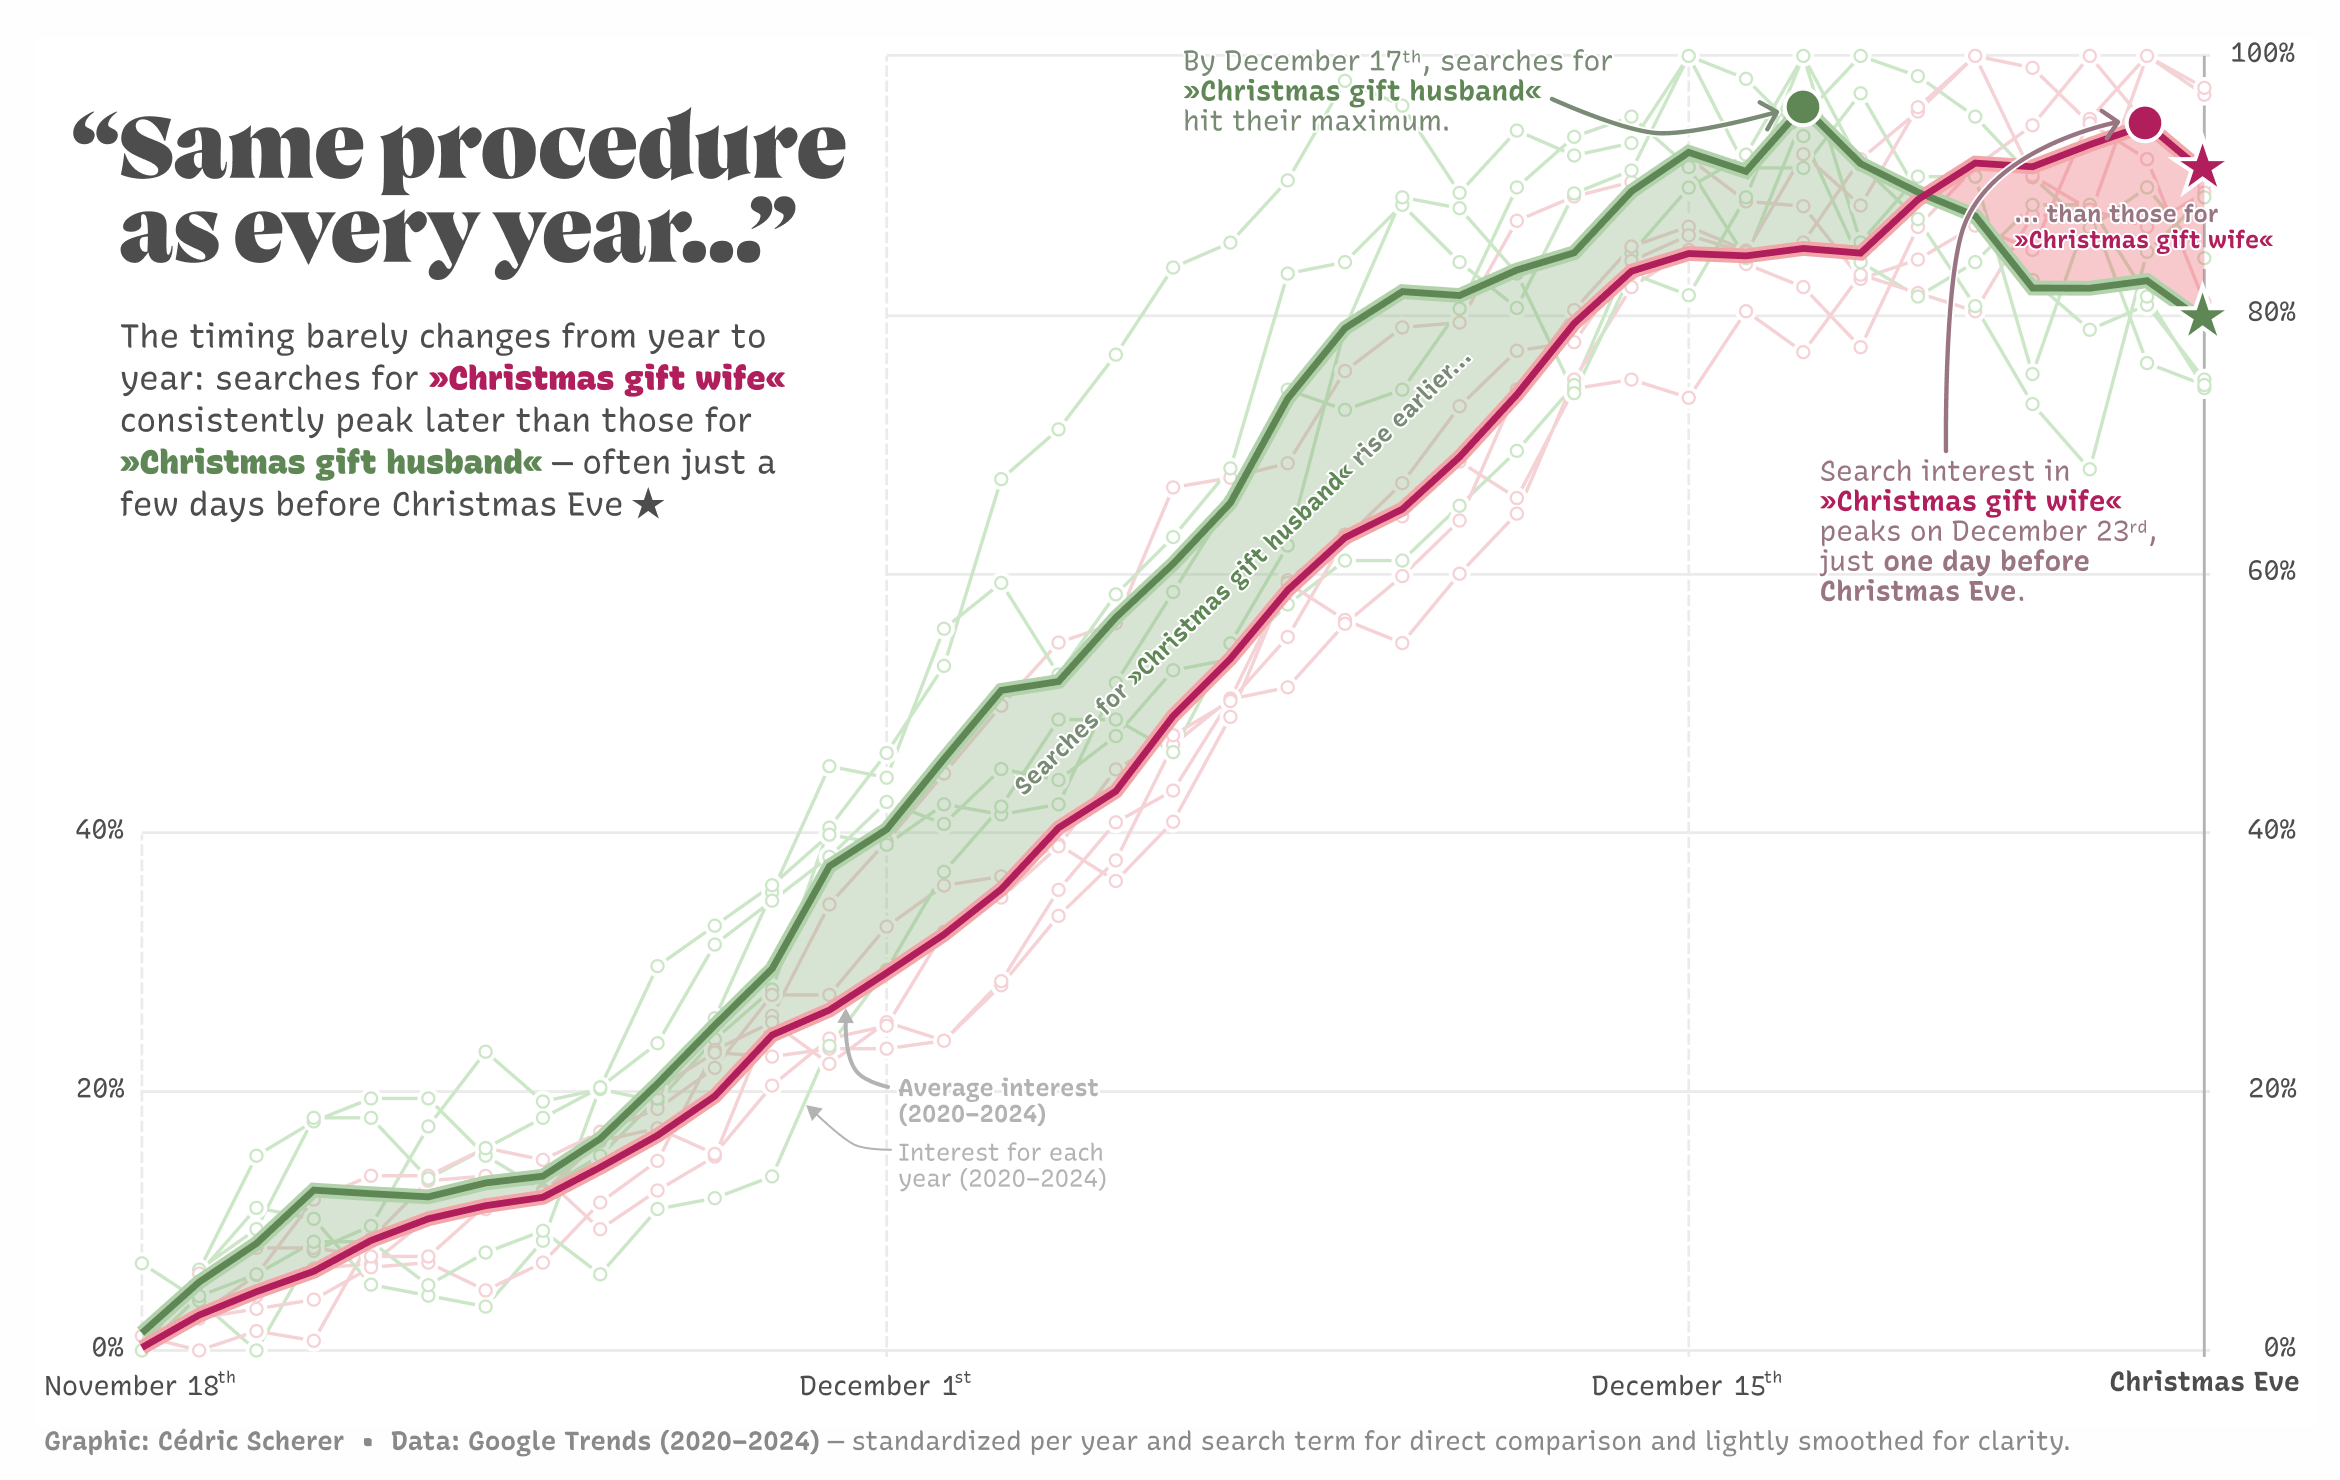
Every December, search behavior follows a stable rhythm. Looking at Google search interest from November 18–December 24 (2020–2024), one pattern keeps repeating:
🎅 “Christmas gift wife” peaks just days before Christmas Eve
🎅 “Christmas gift husband” peaks noticeably earlier
Hope you’ve got all your presents ready by now!
📊 Data: Google Trends, standardized on a yearly basis
🛠️ Made with ggplot2 and Figma
by Z3ttrick
5 Comments
I can’t say I’m surprised
And if you get really lucky the “gift” he buys you is an electric toothbrush that the next day he starts using for himself. So thoughtful 🙄
This reminds me, gotta get my wife a gift !
To some degree its nice to know that most people dont have their shit together
At first glance, I liked your plot but on a second thought I really don’t get it. What’s in the axis? Percent of what? If this is cumulative probability of searches, how can it have a “peak “?
Also, the difference in peak percent to previous or next day is barely 10%. Assuming that’s not just variability without any meaning, what conclusion can one take on these 10%?