Do you put your holiday lights up right after Thanksgiving?
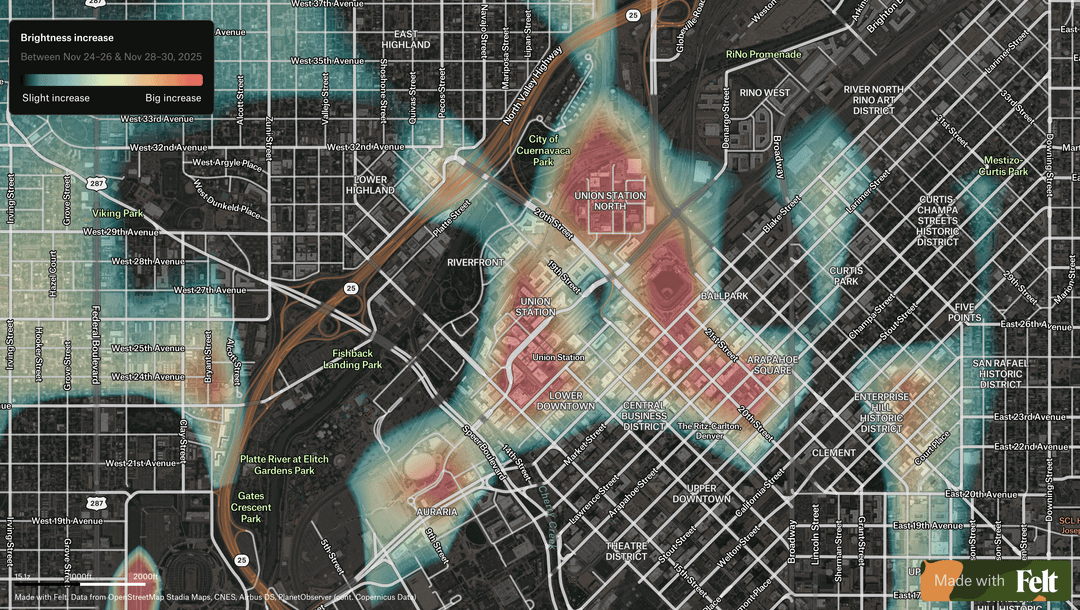
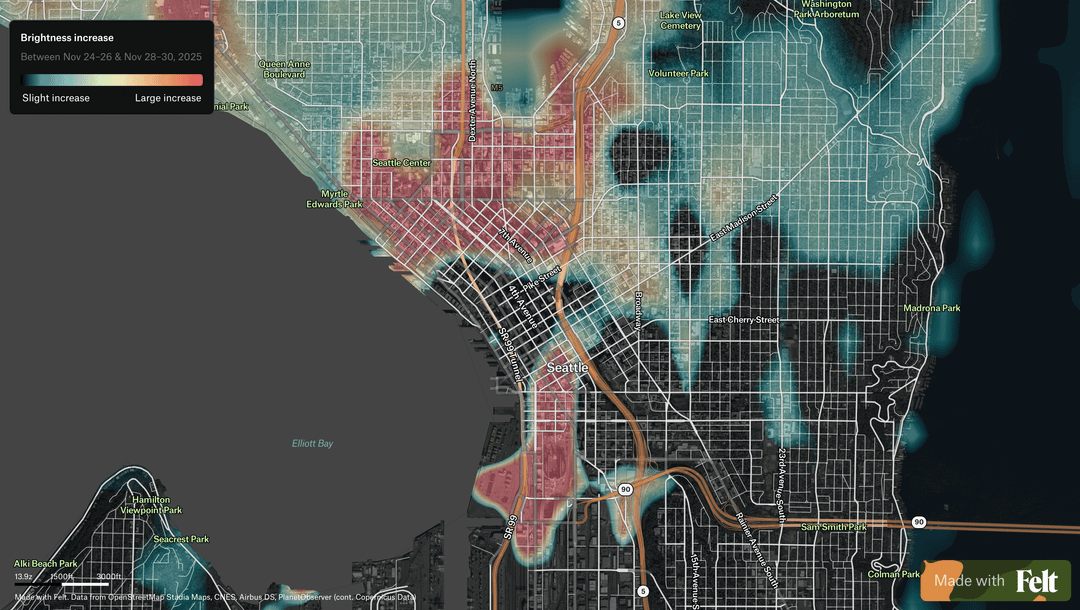
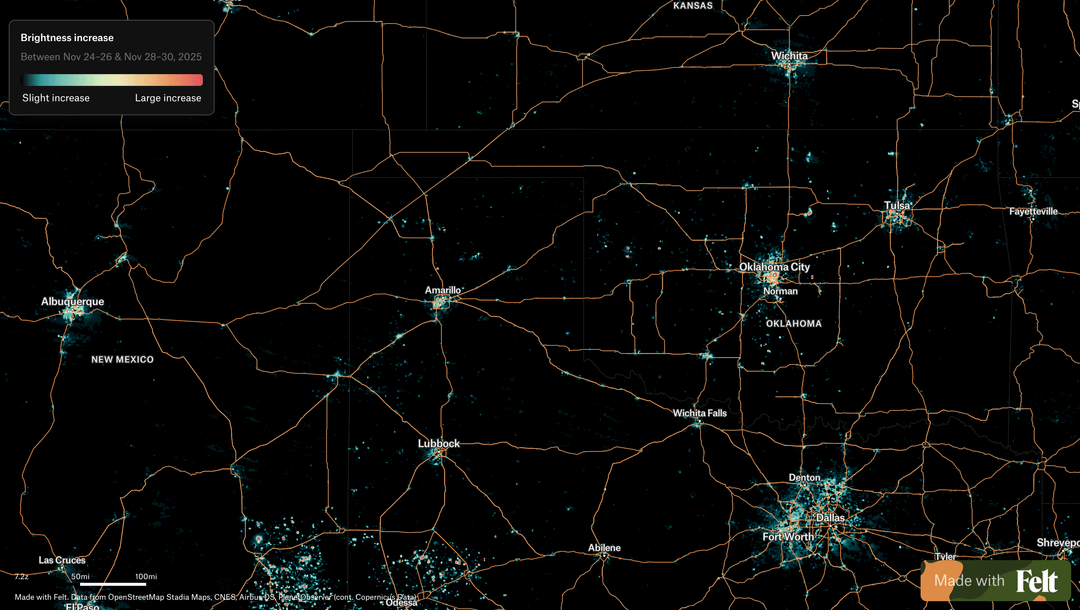
This map compares averaged nighttime brightness before Thanksgiving (Nov 24th – 26th) to averaged brightness a few days after (Nov 28th – Nov 30th).
**Each location is compared to itself over time**, so permanent city lighting fades into the background and locations that increased in brightness are highlighted rather than places that are already bright overall.
Not drawing strong conclusions here – mostly curious what spatial patterns or regional differences people notice when they zoom in! Could the increase be tied to a mix of holiday decorations and Thanksgiving weekend activity even Black Friday?

1 Comment
Do you put your holiday lights up right after Thanksgiving?
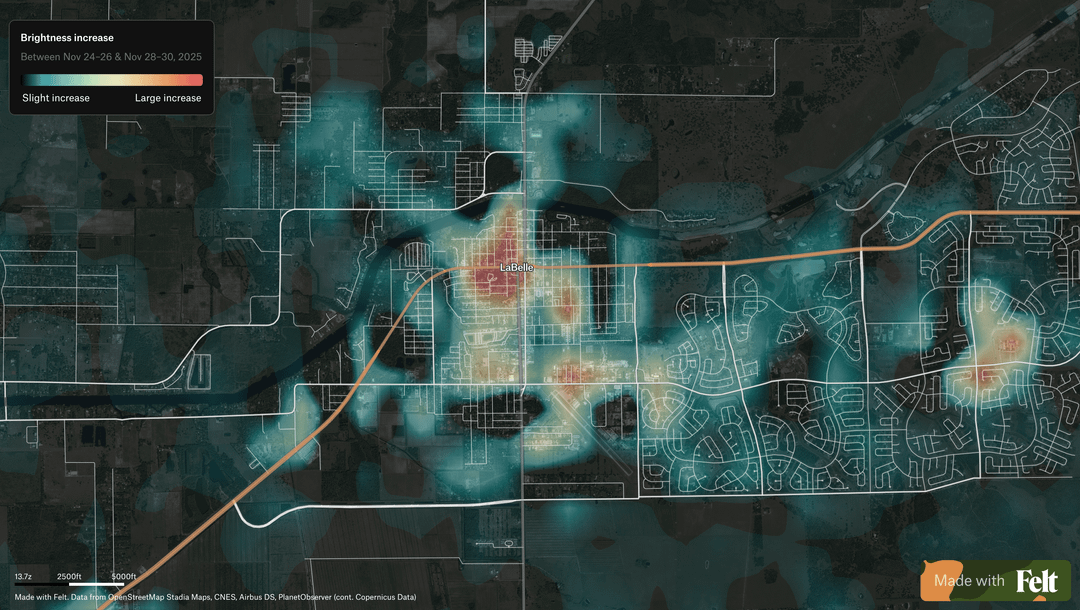
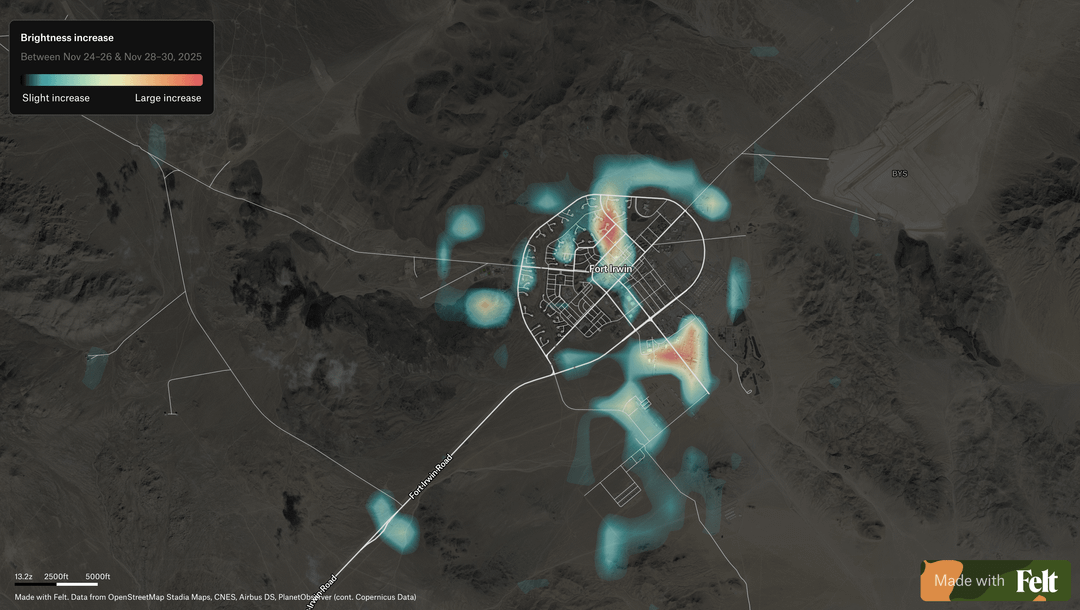
This map compares averaged nighttime brightness before Thanksgiving (Nov 24th – 26th) to averaged brightness a few days after (Nov 28th – Nov 30th).
**Each location is compared to itself over time**, so permanent city lighting fades into the background and locations that increased in brightness are highlighted rather than places that are already bright overall.
Not drawing strong conclusions here – mostly curious what spatial patterns or regional differences people notice when they zoom in! Could the increase be tied to a mix of holiday decorations and Thanksgiving weekend activity even Black Friday?
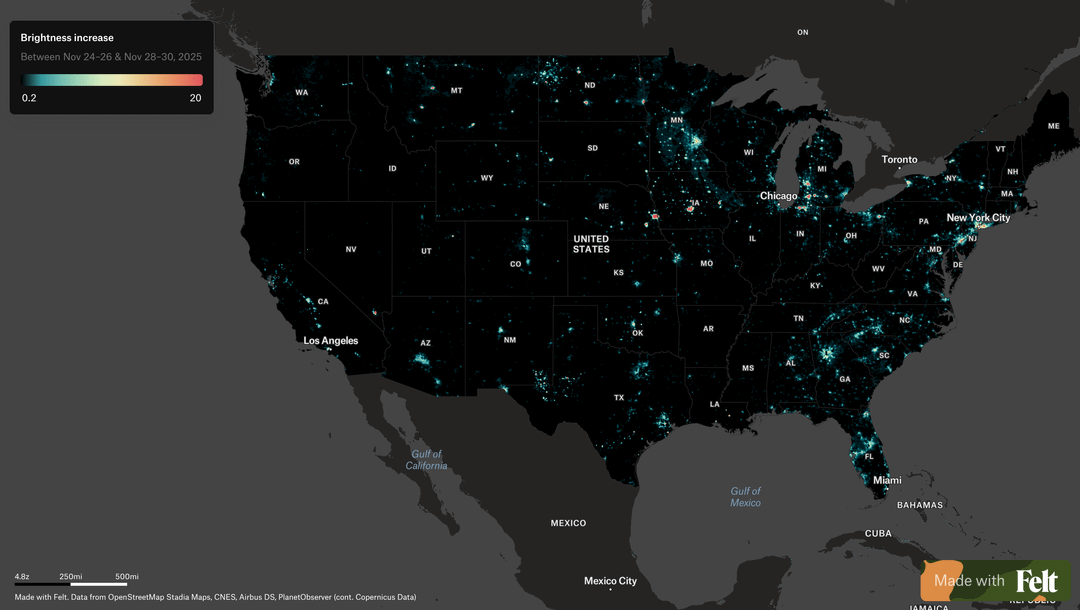
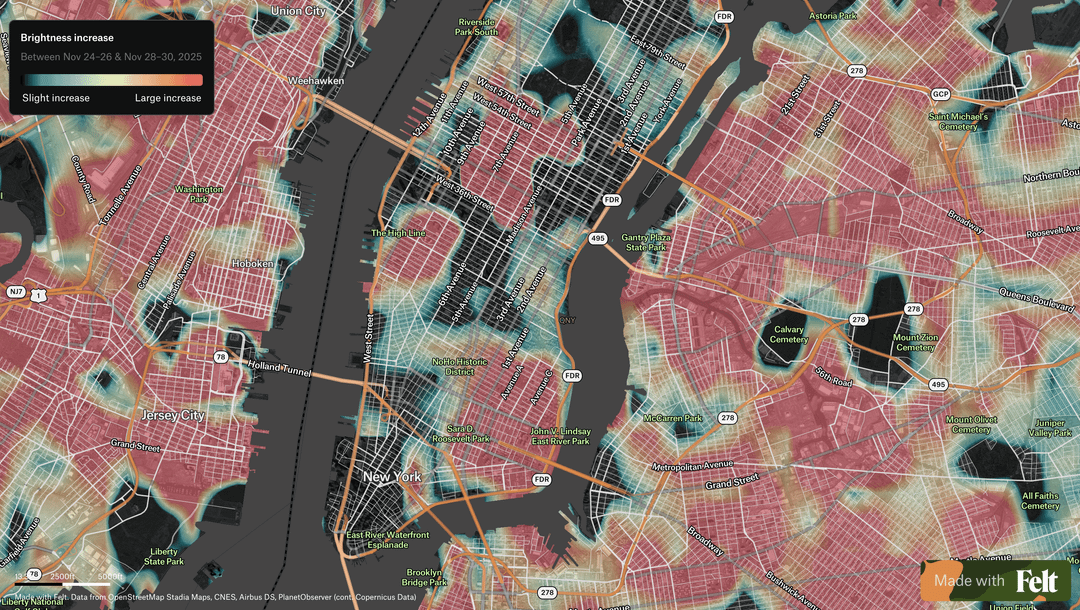
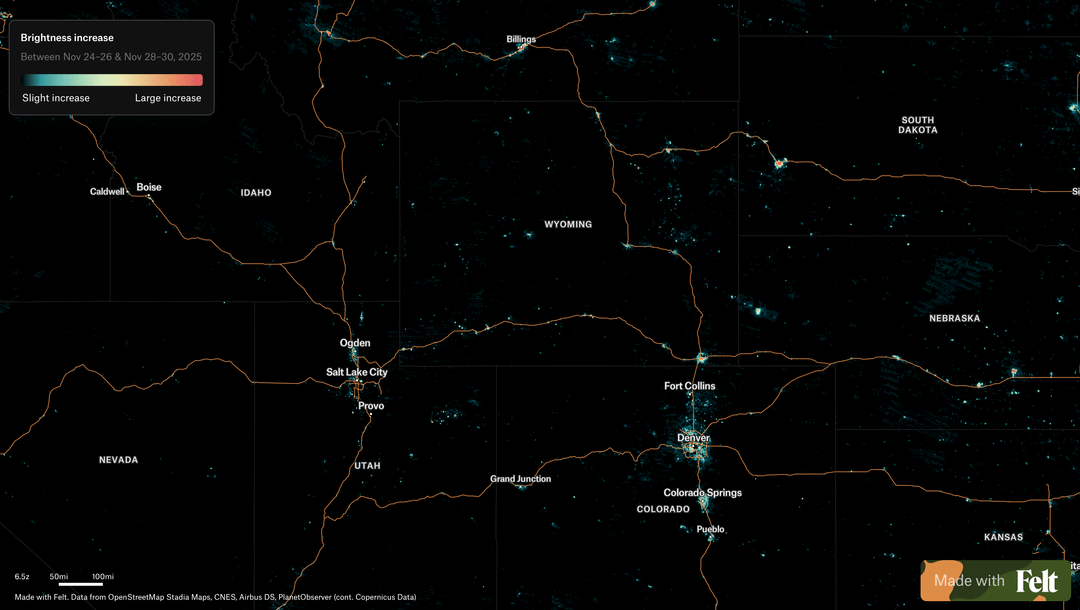
**Map link: try zooming in to see the imagery and evaluate an area you are familiar with**
[https://felt.com/map/Lights-up-XpwkrPrLQNSR9B4oJPlNTiD?loc=36.211,-99.796,5.45z](https://felt.com/map/Lights-up-XpwkrPrLQNSR9B4oJPlNTiD?loc=36.211,-99.796,5.45z)
**Data source:**
NASA VIIRS Day/Night Band
**Tools:**
GDAL and r/Felt