Docs_For_Developers on December 22, 2025 7:16 am **Data Source** Historical Data (1850–1970): Song et al. (2020), “Long-Term Decline in Intergenerational Mobility in the United States since 1850” Modern Data (1980–1993): Chetty et al. (2014), “Where is the Land of Opportunity?” **Tools** Chart.js, HTML/CSS **Methodology** This chart tracks the Rank-Rank Correlation of income. * 0.0 = Perfect Mobility (Parent rank doesn’t predict child rank). * 1.0 = Perfect Immobility (Child rank is determined entirely by parent rank). The data shows a rise from 0.17 in the 1850s to ~0.34 today, indicating that class mobility has significantly decreased over time. **Code** [https://github.com/theaustinhatfield/IncomeMobility](https://organic-waffle-pjwxg7jp44q9h777r.github.dev/) ^ lmk if you’re interested in adding other countries to the graph I think that could be cool
Every-Cup-4216 on December 22, 2025 7:25 am Wow, so the most prominent dip appears to have surfaced during WW2, meaning that ex-military likely drove the increased income mobility.

2 Comments
**Data Source**
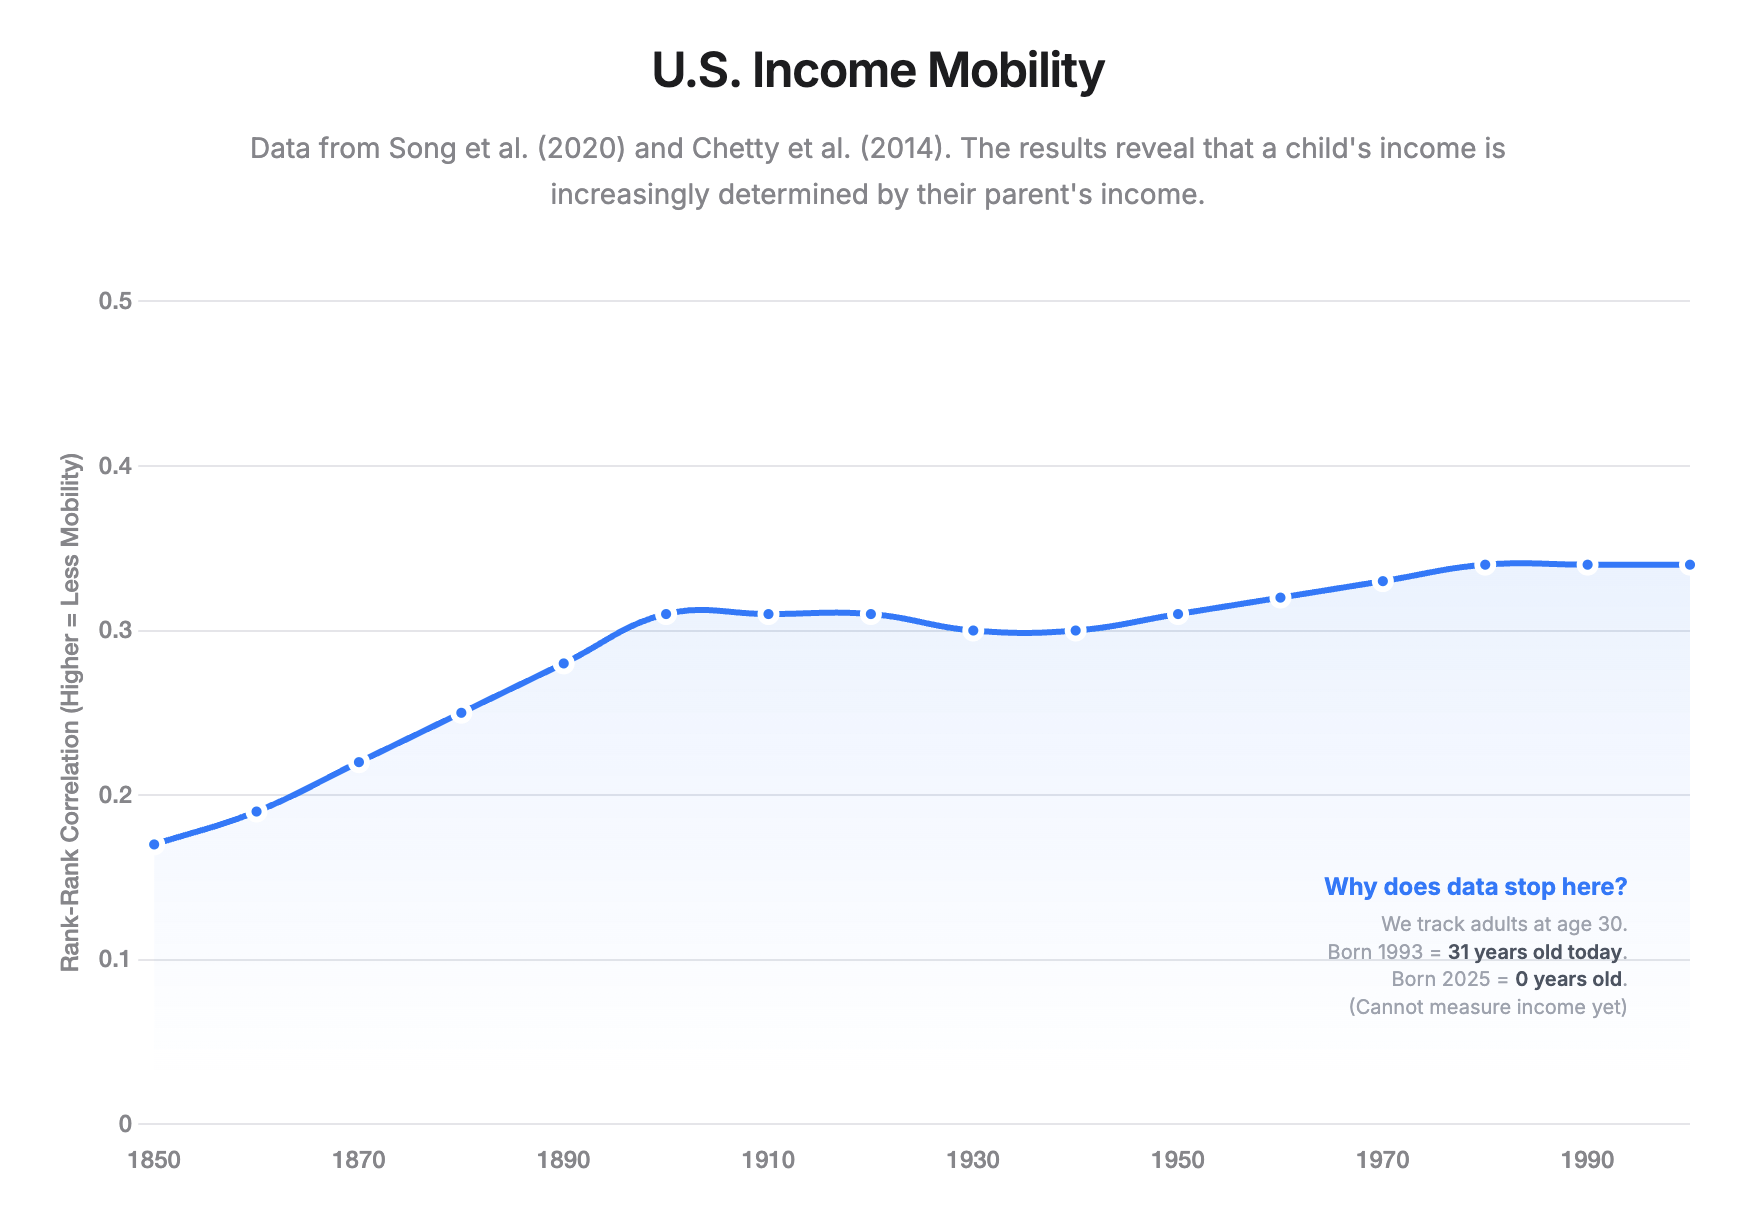
Historical Data (1850–1970): Song et al. (2020), “Long-Term Decline in Intergenerational Mobility in the United States since 1850”
Modern Data (1980–1993): Chetty et al. (2014), “Where is the Land of Opportunity?”
**Tools**
Chart.js, HTML/CSS
**Methodology**
This chart tracks the Rank-Rank Correlation of income.
* 0.0 = Perfect Mobility (Parent rank doesn’t predict child rank).
* 1.0 = Perfect Immobility (Child rank is determined entirely by parent rank).
The data shows a rise from 0.17 in the 1850s to ~0.34 today, indicating that class mobility has significantly decreased over time.
**Code**
[https://github.com/theaustinhatfield/IncomeMobility](https://organic-waffle-pjwxg7jp44q9h777r.github.dev/)
^ lmk if you’re interested in adding other countries to the graph I think that could be cool
Wow, so the most prominent dip appears to have surfaced during WW2, meaning that ex-military likely drove the increased income mobility.