
👉 https://storage.portaljs.com/
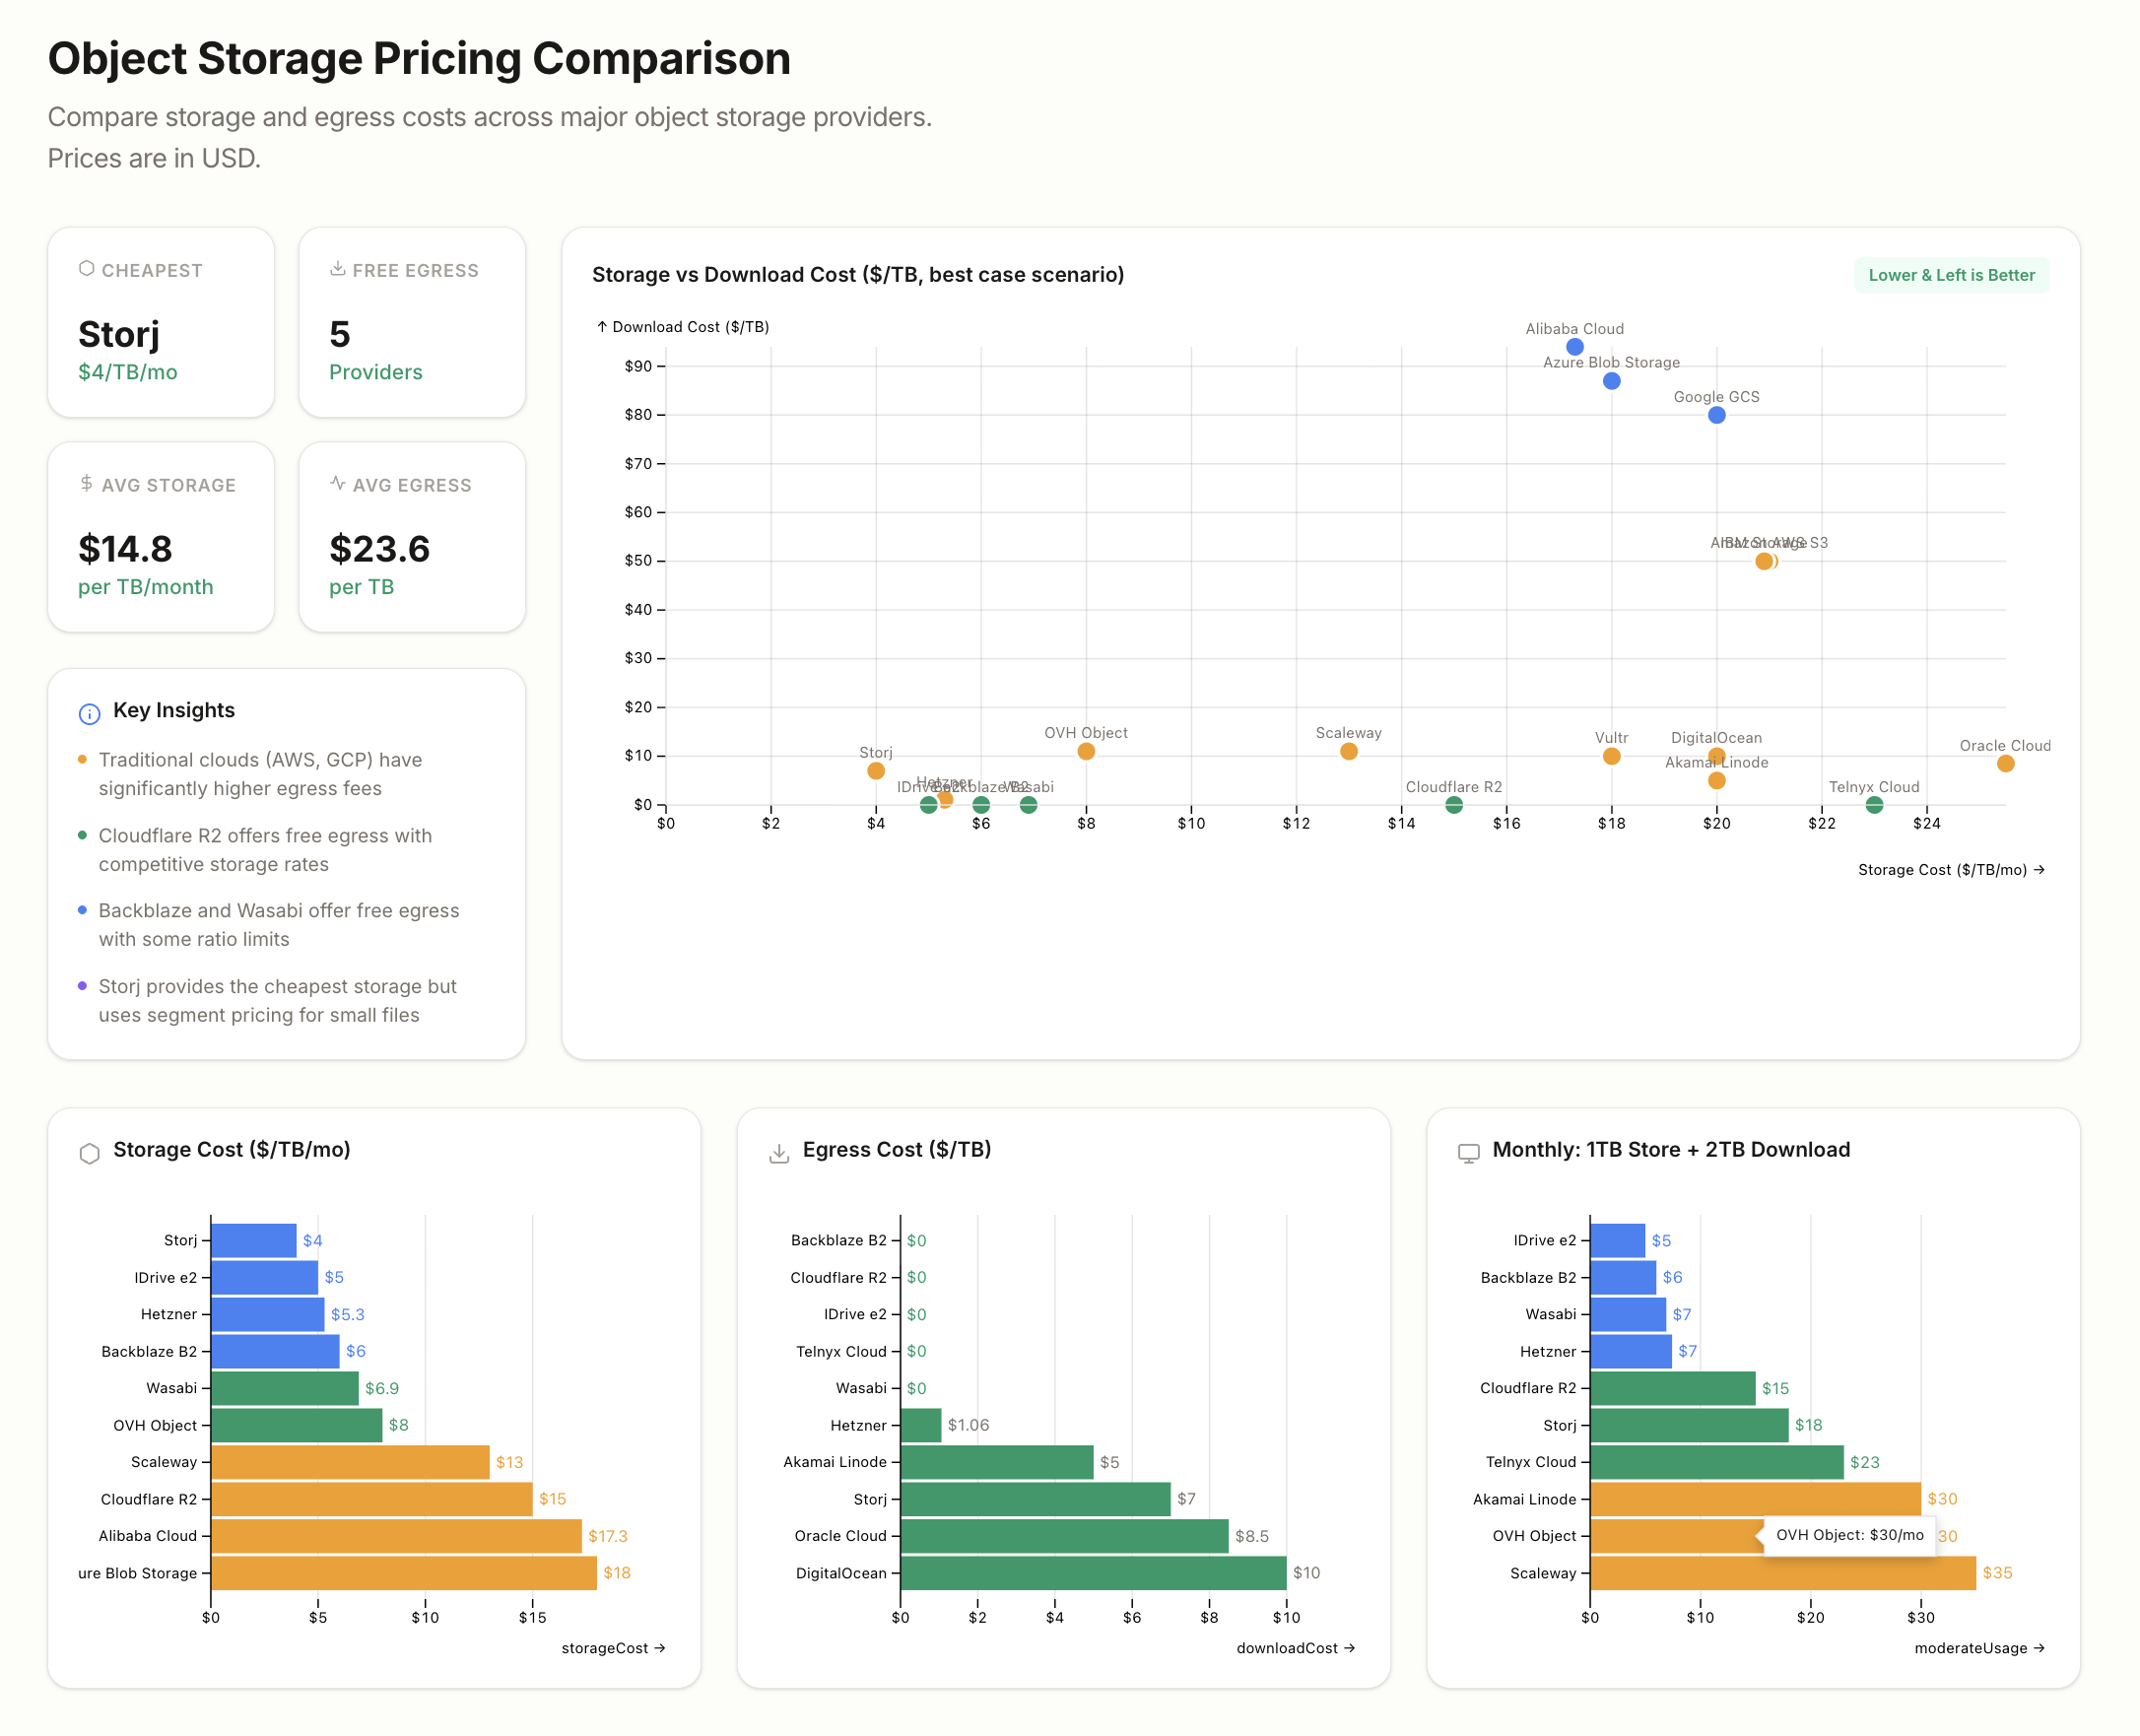
We built this visualization because our team runs an Open Data projects where we publish large CSV datasets for free public access. We quickly learned that while storage is cheap, egress (data transfer) is the silent killer for open access projects.
The "Egress Tax" Problem: As you can see in the chart, if you serve 50TB – 100TB of data to the public:
- Google (GCS), AWS S3 & Azure charge massive fees just to let people download the data (~$80 per TB).
- Cloudflare R2 (and a few niche players) offers free egress, which saved our project. We moved our public-facing buckets to R2 to stop the bleeding.
The Nuance: Storage vs. Egress However, the visualization highlights a trade-off we often miss. While R2 solves the bandwidth cost, it lacks the "Cold/Archive" storage tiers you get with the big providers.
- Hot Data: R2 is great ($0.015/GB).
- Cold Backups: If you are storing 100TB of database backups that you rarely touch, AWS S3 Glacier Deep Archive ($0.00099/GB) is roughly 15x cheaper than R2.
We built this dashboard to let you toggle these variables (Storage Volume vs. Transfer Volume) to find the break-even point for your own architecture.
by anuveya
2 Comments
Cool. I’ve also always wanted to visualize some kind of “efficient frontier” of storage vs some kind of usage option to see where different cloud storage providers shine …
The question here is *why* is anyone on AWS S3 anymore …