
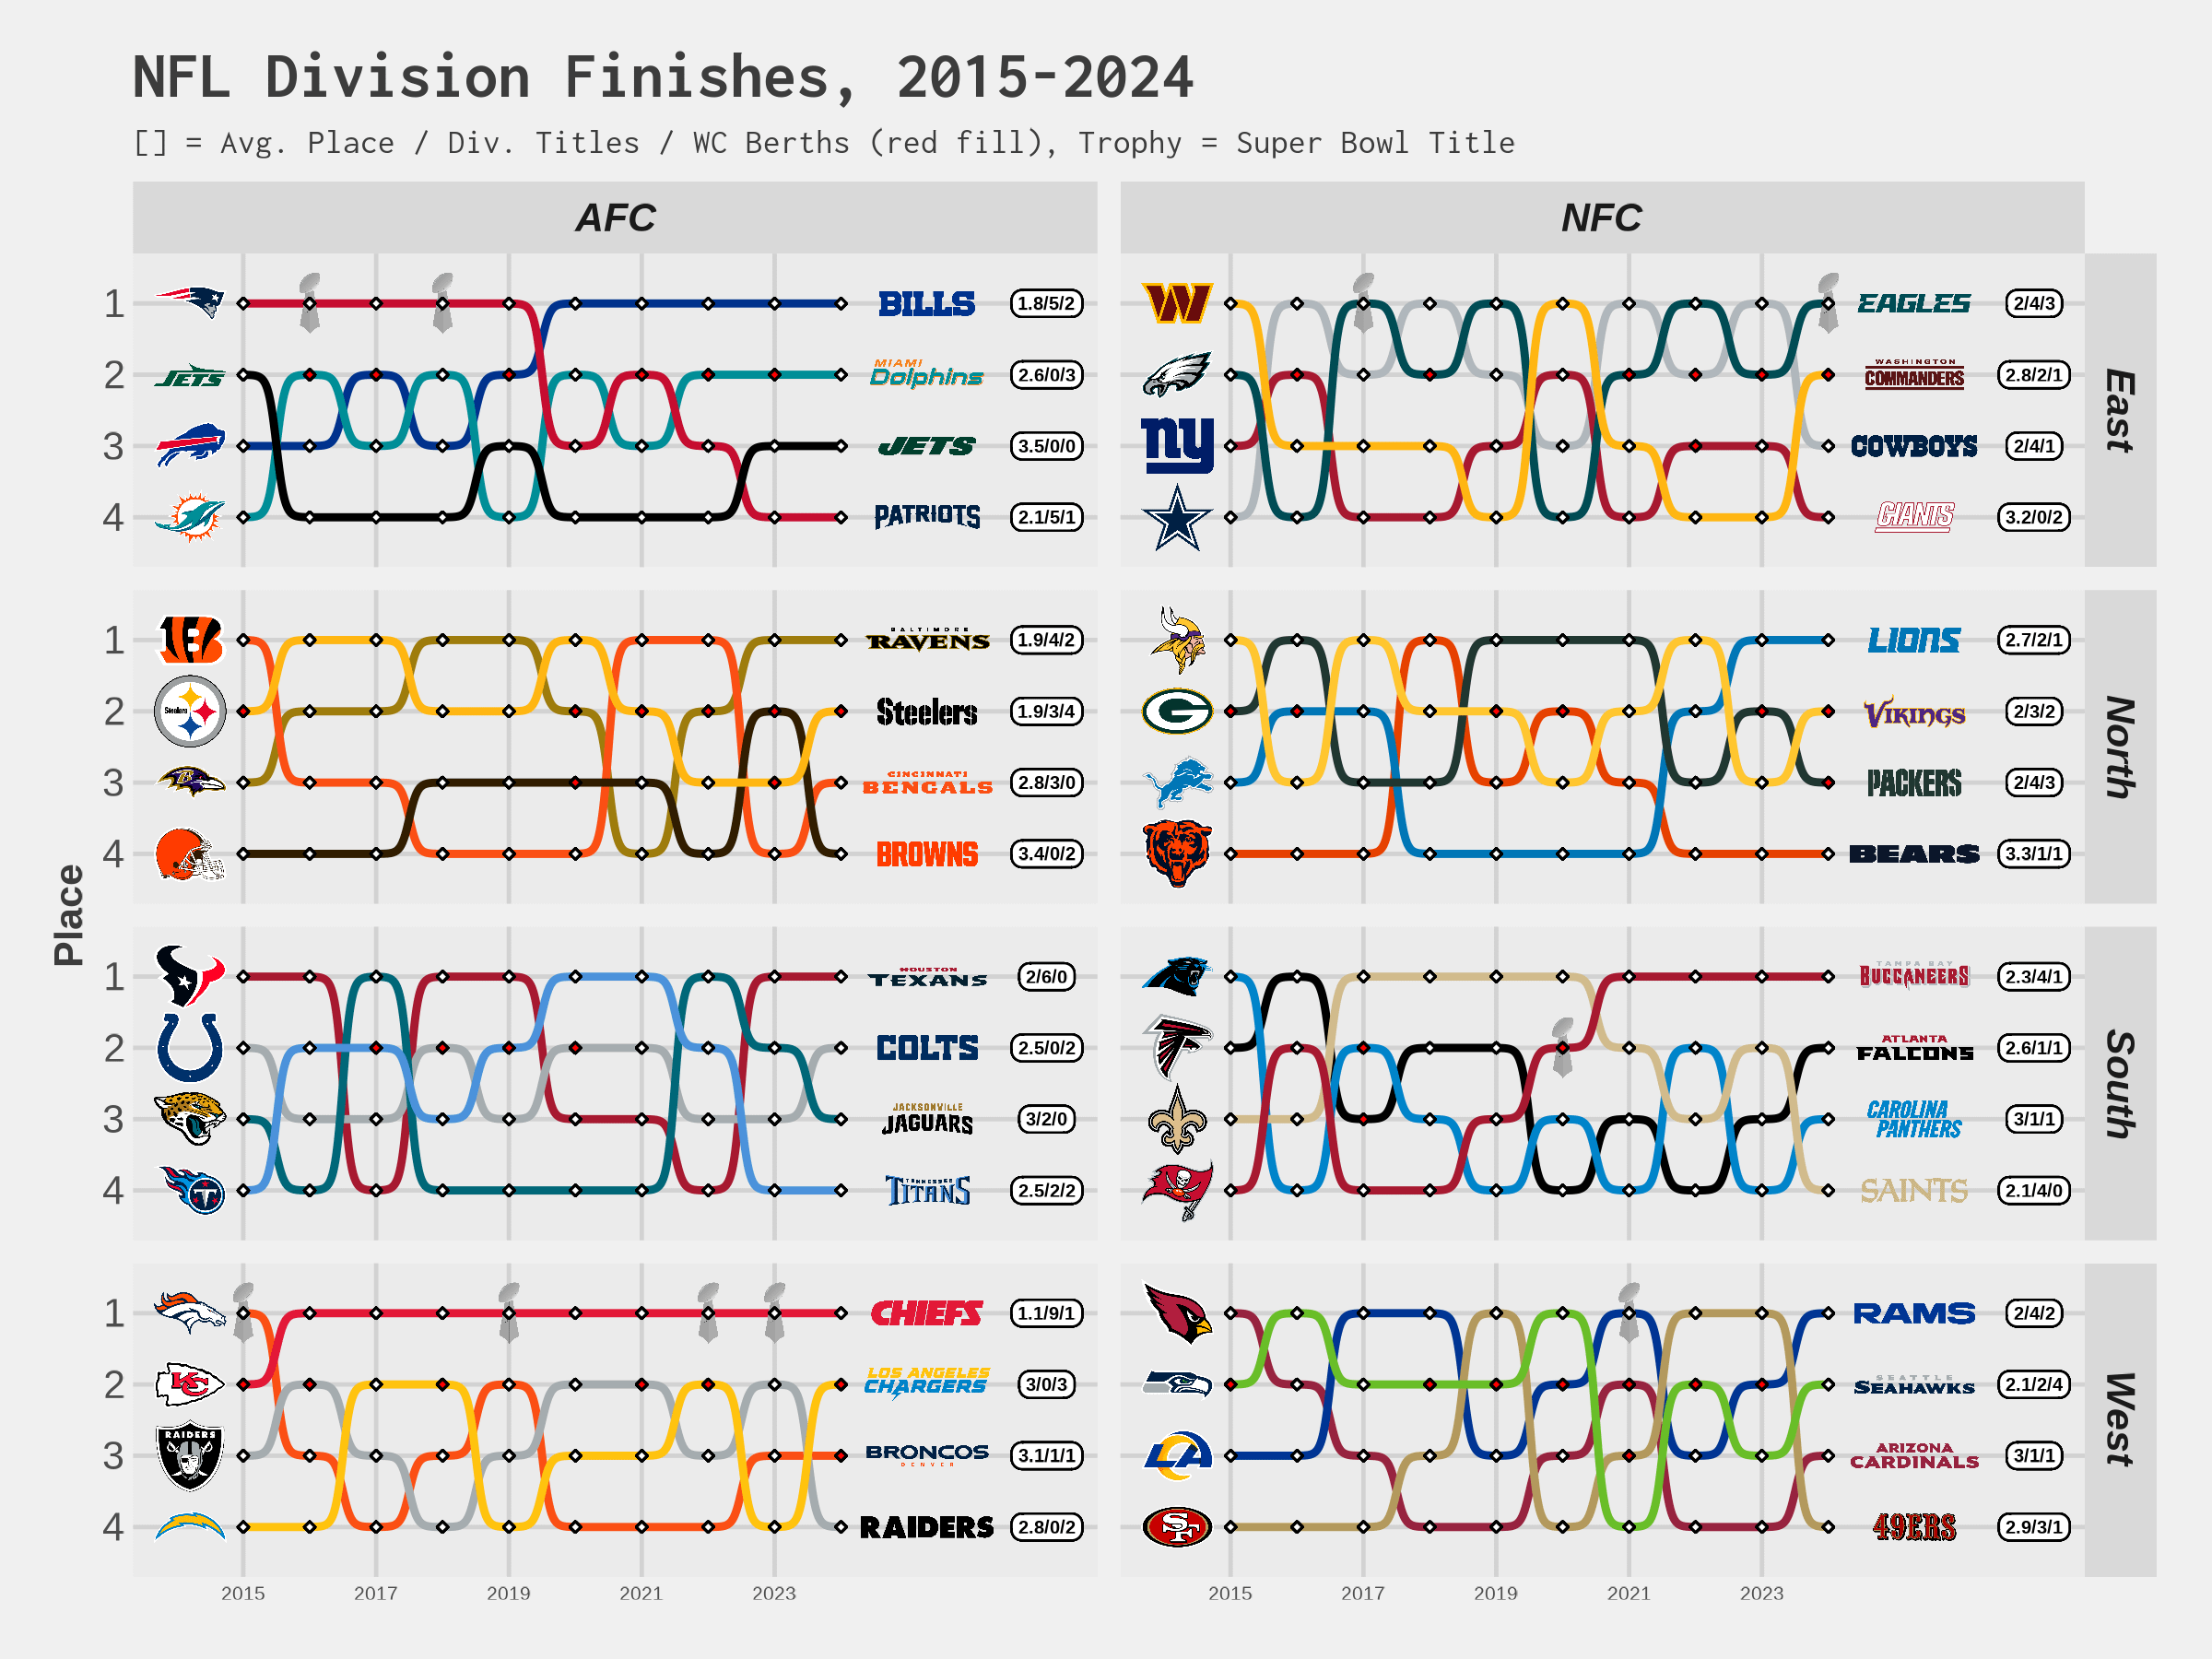
Something for the NFL enjoyers in here. Since last weekend included Patrick Mahomes tearing his ACL and the Kansas City Chiefs fully falling out of playoff contention, I thought I'd share this chart of team division finishes, which gives a peek into how consistently successful KC has been over the 10 prior seasons. For context, Mahomes took over as the starter in 2018.
It was my first crack at a bump chart, and I probably tried to cram too much in, but it at least feels like a fun way to visualize the info.
Data source: Pro Football Reference
Tools: R
by numbers_in_figs