
This is from a little side project I’ve been hacking on in my spare time.
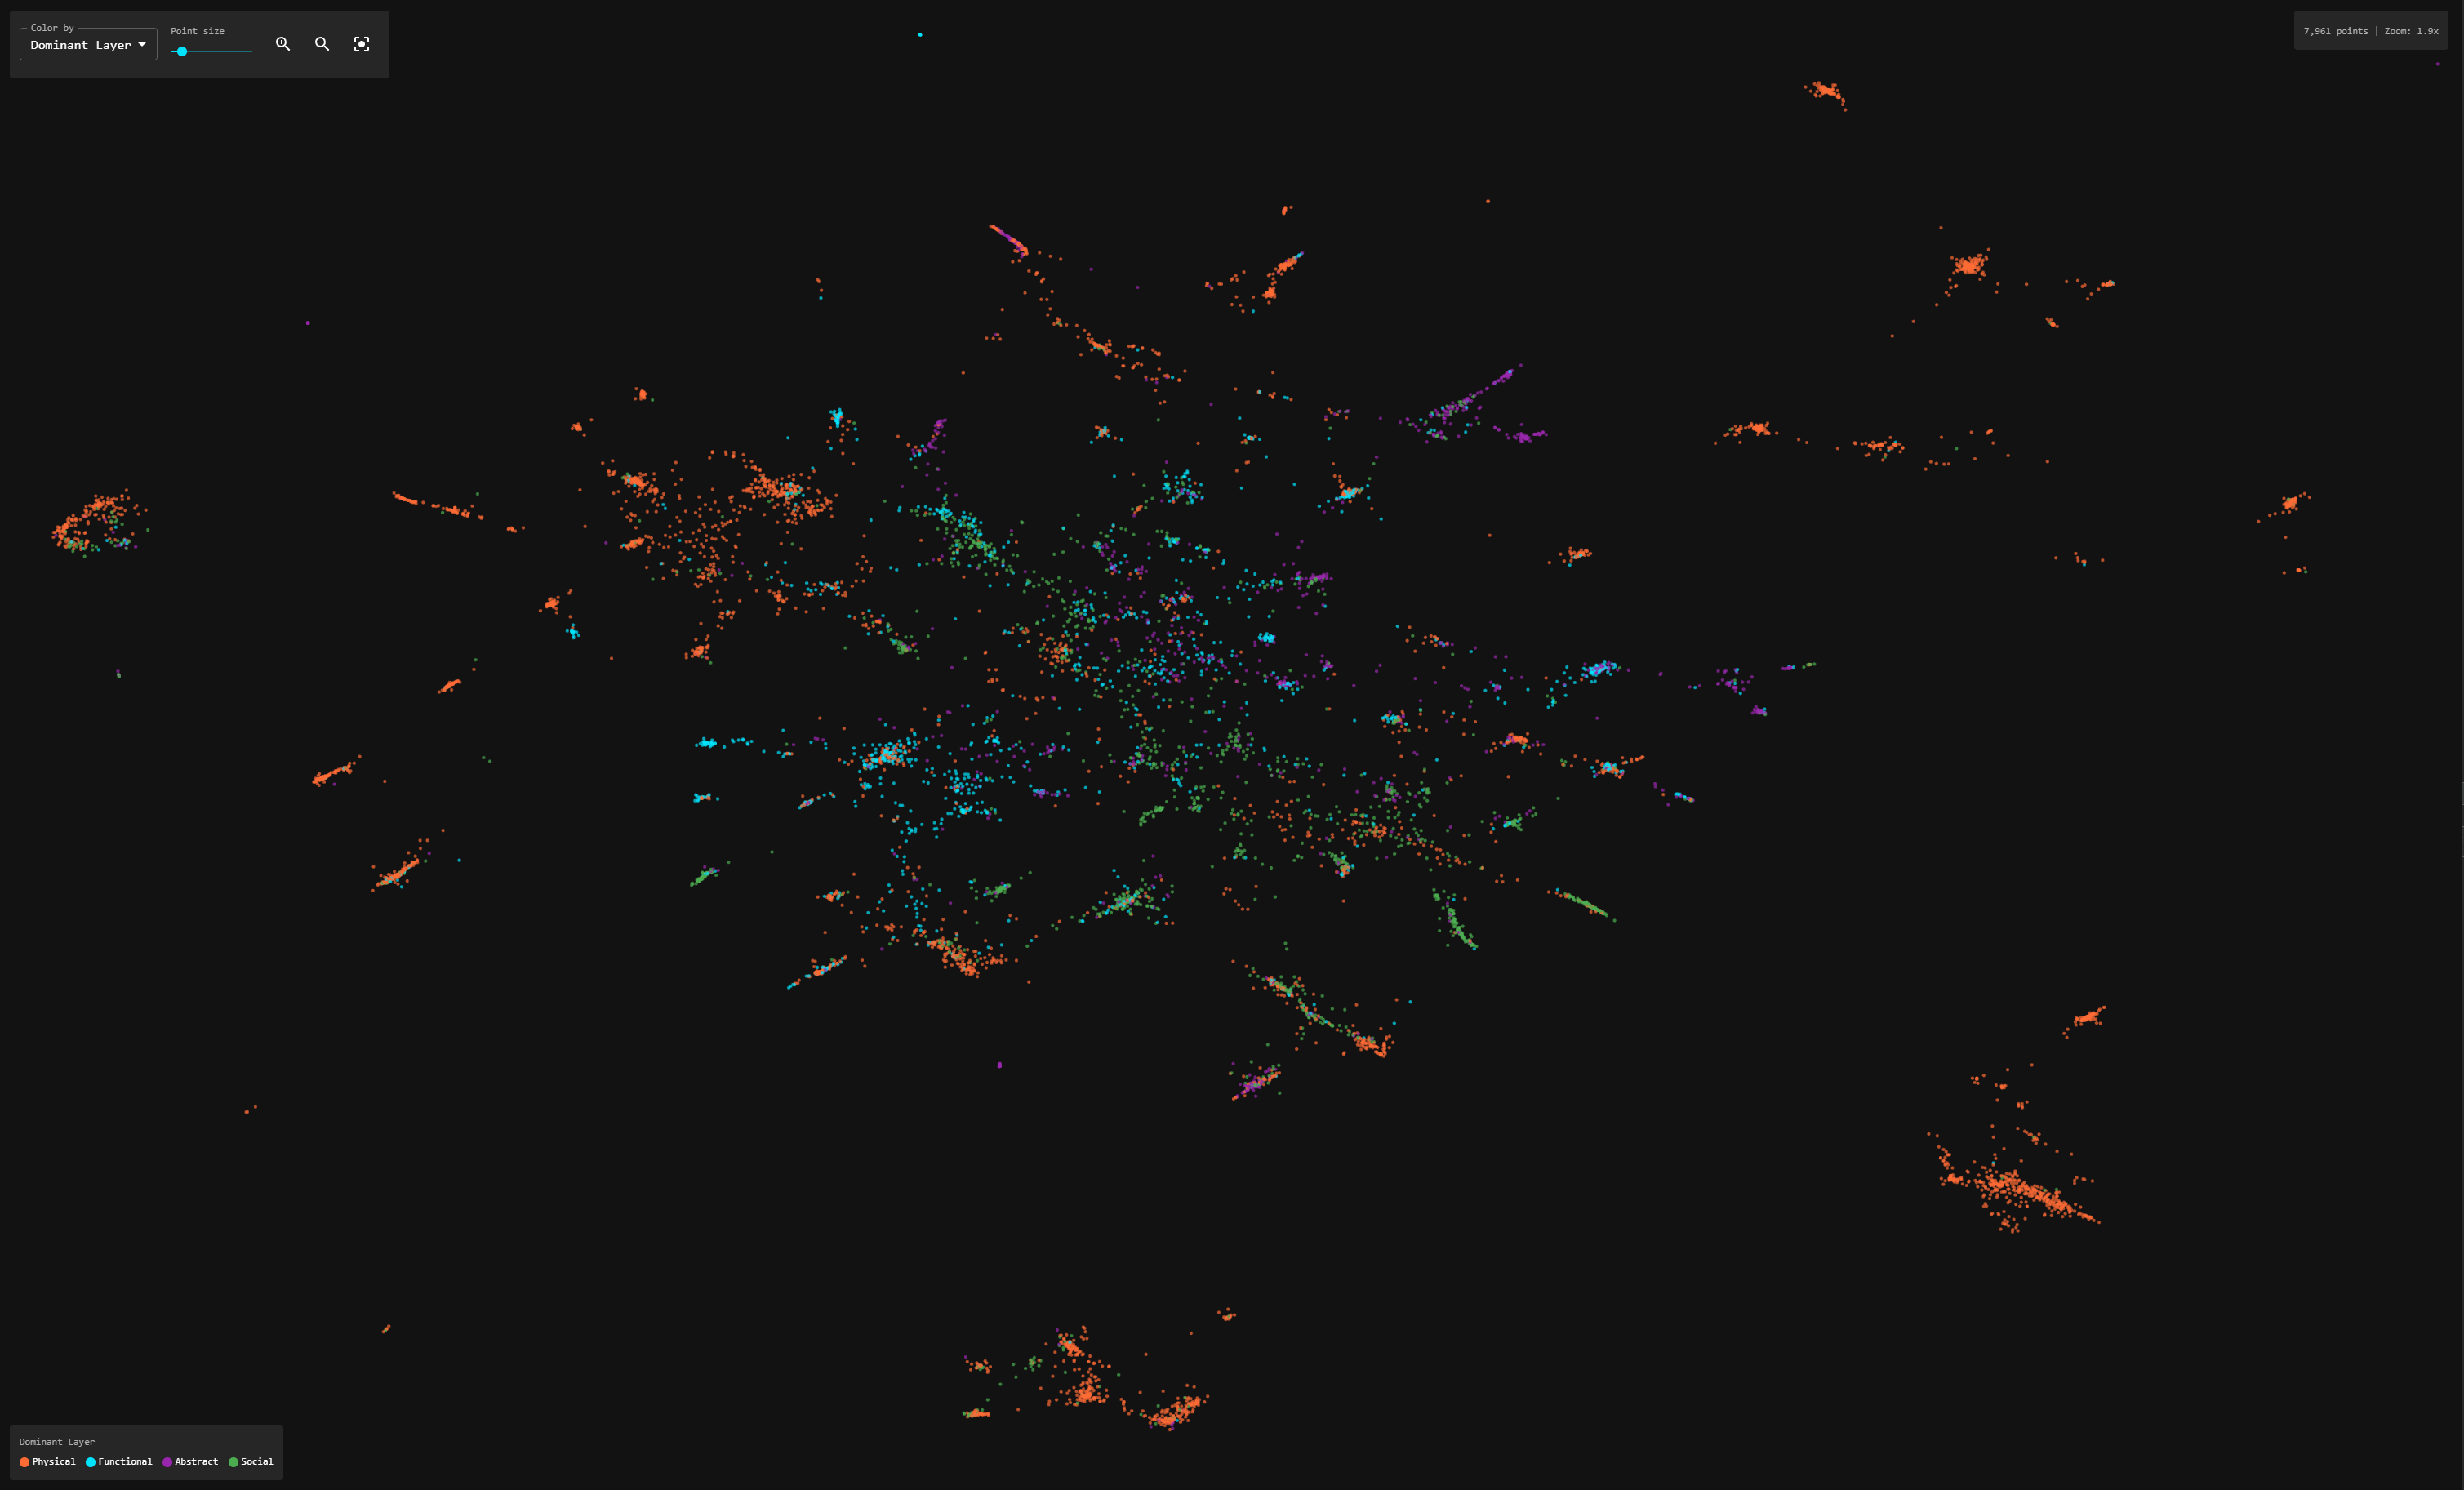
Each dot is a thing in the world, anything from “Blue Wine” to “Station Clock” to “Use of Gallium in Cancer Therapy”. I wrote a short description for each one and fed it into a standard language-model embedding, then used UMAP to squash that high-dimensional space down to 2D.
So the positions of the dots come purely from the language model: if two descriptions tend to appear in similar text contexts, they end up close together. It’s the usual “semantic embedding” people use for search and recommendation.
Separately, I’ve been building my own tiny ontology called Universal Hex Taxonomy (UHT). It gives every entity a 32-bit code that tries to capture what kind of thing it is in reality. It uses 32 traits, 8 each for Physical, Functional, Abstract, and Social 'layers'. For this chart I’ve just coloured each point by whichever of those four layers is dominant for that entity.
So this picture is basically:
“How a language model organises the world (layout), painted with how my ontology thinks the world is structured (colour).”
Big clusters of physical objects dominate the periphery, whilst the layers are far more mixed in the complex 'core'.
It’s all very much work-in-progress personal research, but I’m experimenting with using this 32-bit code as a second axis alongside embeddings to find non-obvious analogies and also places where language quietly conflates completely different kinds of things. Happy to answer questions if anyone’s curious.
It's all live and accessible (each point is a database entry which can be expanded), but I won't shamelessly self promote!
Let me know what you think!
Update – just read the rules.
source: https://factory.universalhex.org/explorer
Data is partly Wikidata, partly LLM generated curated list
Application vibecoded using Claude Code
by South_Camera8126