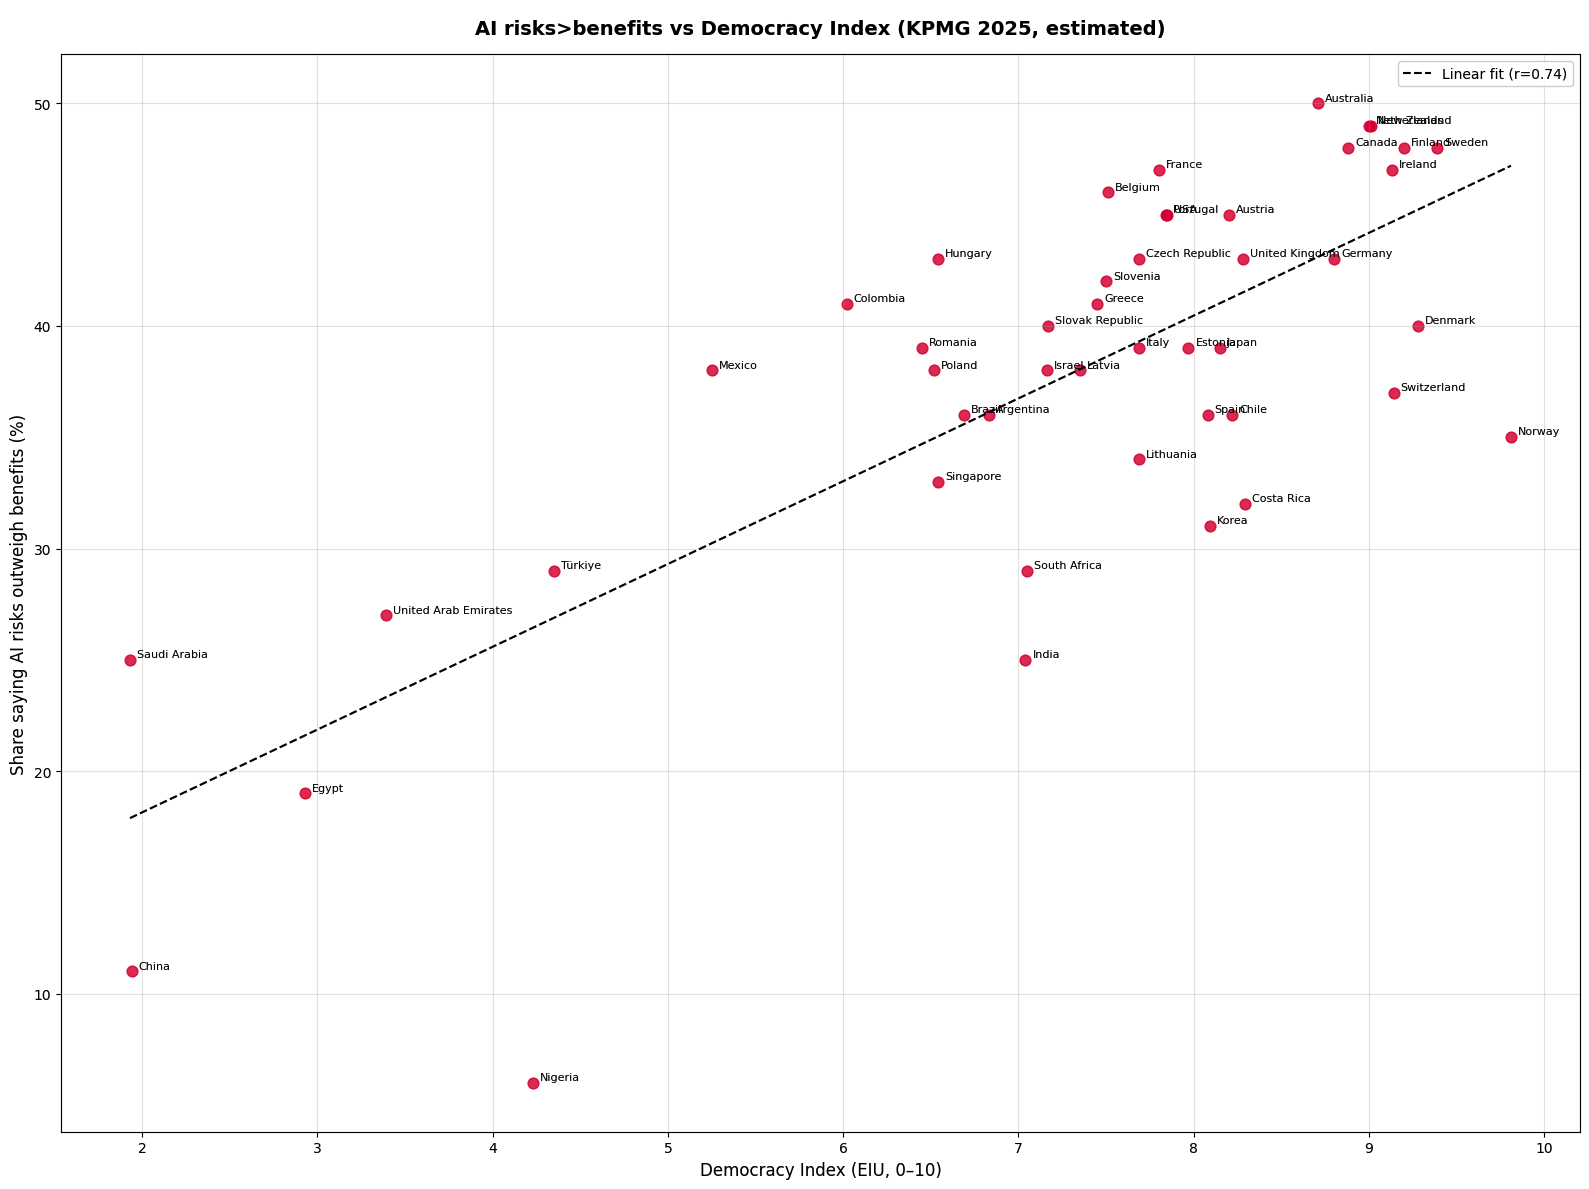
Edit: USA is overlapping with Portugal on the plot (left of Austria).
yalag on
how do you measure skeptism if you cant speak?
randomtask on
AI is a fundamentally authoritarian technology. It is a centralized resource for “truth”. With AI, truth is not a collective process of mutual agreement. It is the owners of the model, who train it and operate it and charge people to access it, that get to decide what “truth” is.
BallerGuitarer on
r/dataisinteresting and r/dataiscompelling but r/dataisnotbeautiful because I had a hard time finding USA until I found USAugal.
drillbitpdx on
Where is the USA on this graph? 🤔
It looks like there’s a data point precisely overlapping with Portugal, might be USA, as well as “New Zealand” and “Netherlands” overlapping. You should add a little bit of jitter to the data points and labels to make this readable.
Quite easy to generate a zero-centered jitter with `y_values + (np.random.random_sample(y_values.shape) – 0.5)*MAGNITUDE_OF_JITTER`.
eskimospy212 on
It’s hard for me to believe the survey standards are consistent across countries.
Happy_Development_39 on
The fuck is that regression line
This is just Europe-is-many-countries as a graph
Who the fuck pays those idiots
Few-Interview-1996 on
Perhaps they would welcome their AI overlords?
ImpossibleDraft7208 on
I’m in a third camp: I belive that BOTH the risks and benefits are wildly overstated and it will be a nothingburger once the dust of the ginormous financial bubble popping settles!
sojuz151 on
Look at that data, this is why linear analysis is not everything. You have a blob of democratic countries and couple of random points for low democratic.
thatguyfromthesubway on
There is a strong correlation between a country’s Democracy index and their truthfulness in answering surveys
rutgerrk on
Guess I’m moving to a dictatorship next year
RealFackie on
Luckily everybody knows that correlation always means there is 100% guaranteed causation.
Tadedy on
The regression will be highly influenced by the outliers with low democracy index so i would be careful when considering this result
Dacadey on
A prime example of how correlation doesn’t equal causation. It’s a meaningless plot.
What the study was actually talking about is correlating AI skepticism and the degree to which the economies, education, and healthcare are developed, so essentially the graph should be AI skepticism vs HDI – and not some random democracy index.
To quote from the study itself:
>AI systems may be perceived and experienced as more beneficial in emerging economies because of their ability to fill critical resource gaps and provide greater relative opportunities to people. For instance, the use of AI systems in healthcare has the potential to enhance service delivery and improve health outcomes in areas where there is limited access to medical professionals.

15 Comments
Source: [Trust, attitudes and use of artificial intelligence: A global study 2025](https://kpmg.com/xx/en/our-insights/ai-and-technology/trust-attitudes-and-use-of-ai.html)
Tool: [Matplotlib](https://matplotlib.org/) (Python)
—
Edit: USA is overlapping with Portugal on the plot (left of Austria).
how do you measure skeptism if you cant speak?
AI is a fundamentally authoritarian technology. It is a centralized resource for “truth”. With AI, truth is not a collective process of mutual agreement. It is the owners of the model, who train it and operate it and charge people to access it, that get to decide what “truth” is.
r/dataisinteresting and r/dataiscompelling but r/dataisnotbeautiful because I had a hard time finding USA until I found USAugal.
Where is the USA on this graph? 🤔
It looks like there’s a data point precisely overlapping with Portugal, might be USA, as well as “New Zealand” and “Netherlands” overlapping. You should add a little bit of jitter to the data points and labels to make this readable.
Quite easy to generate a zero-centered jitter with `y_values + (np.random.random_sample(y_values.shape) – 0.5)*MAGNITUDE_OF_JITTER`.
It’s hard for me to believe the survey standards are consistent across countries.
The fuck is that regression line
This is just Europe-is-many-countries as a graph
Who the fuck pays those idiots
Perhaps they would welcome their AI overlords?
I’m in a third camp: I belive that BOTH the risks and benefits are wildly overstated and it will be a nothingburger once the dust of the ginormous financial bubble popping settles!
Look at that data, this is why linear analysis is not everything. You have a blob of democratic countries and couple of random points for low democratic.
There is a strong correlation between a country’s Democracy index and their truthfulness in answering surveys
Guess I’m moving to a dictatorship next year
Luckily everybody knows that correlation always means there is 100% guaranteed causation.
The regression will be highly influenced by the outliers with low democracy index so i would be careful when considering this result
A prime example of how correlation doesn’t equal causation. It’s a meaningless plot.
What the study was actually talking about is correlating AI skepticism and the degree to which the economies, education, and healthcare are developed, so essentially the graph should be AI skepticism vs HDI – and not some random democracy index.
To quote from the study itself:
>AI systems may be perceived and experienced as more beneficial in emerging economies because of their ability to fill critical resource gaps and provide greater relative opportunities to people. For instance, the use of AI systems in healthcare has the potential to enhance service delivery and improve health outcomes in areas where there is limited access to medical professionals.