
Full presentation:
https://drive.google.com/file/d/1mk2pr-DK_wcPxRuUVoUnq5_zgEhKakgR/view?usp=sharing
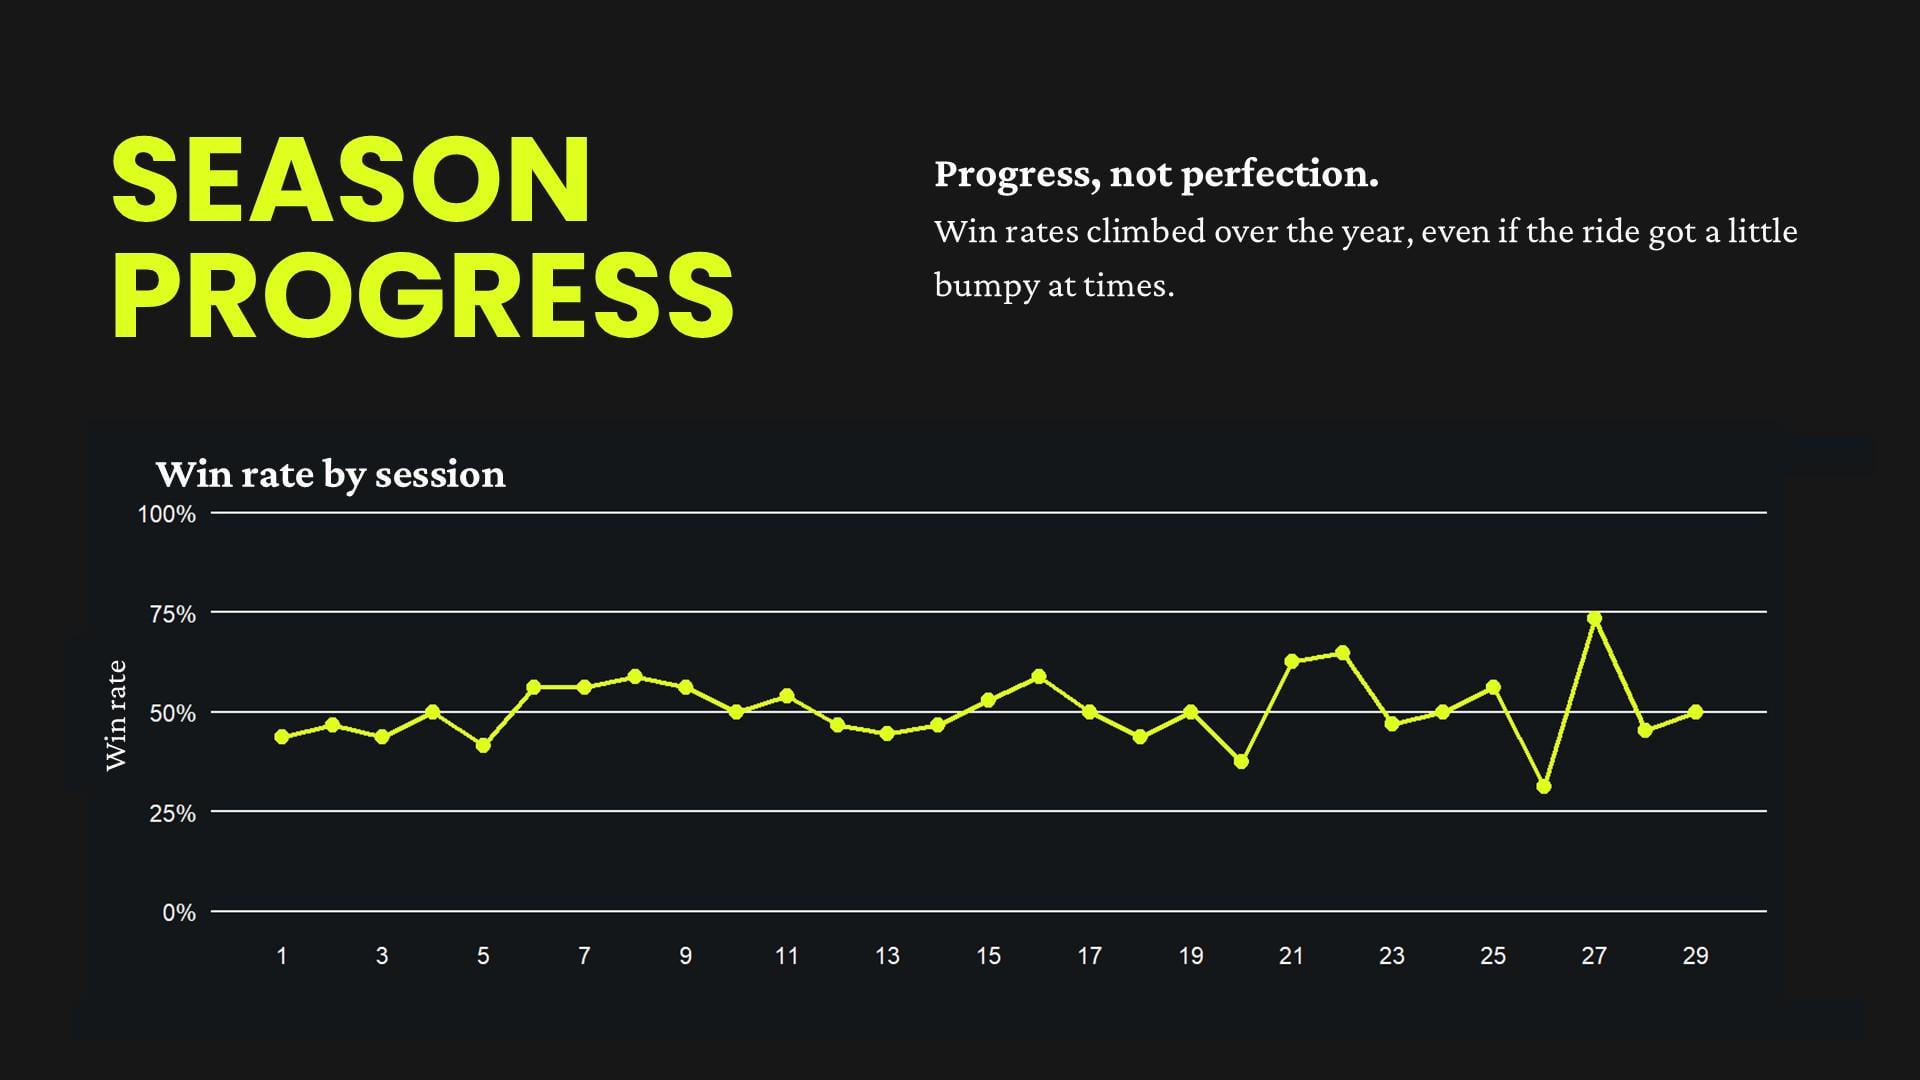
For the past three years, a couple of friends and I have played Rocket League every Sunday night. After each game, instead of just queueing again like normal people… we record the stats. Every game. Every week. For three years.
That includes:
- Team win/loss
- Goals scored & conceded
- Individual points, goals, assists, saves, and shots
- A few very niche metrics that probably didn’t need tracking
We recently pulled everything together into a “Rocket League Wrapped”-style PDF that tells the story of our 2025 season – trends, best nights, worst nights, streaks, and a few hard truths.
A bit of context
- We play as a 3-player team every session
- We are not very good at Rocket League
- This is friendly-competitive, not sweaty ranked grinding
- Ben is clearly the best player (this is documented and undeniable)
- The rest of us bring vibes, structure, and occasionally goals
Important terminology
- Wooden Spoon = scoring under 100 points in a game (Yes, this happens more than we’d like. Yes, it’s tracked.)
This started as a joke, got wildly out of hand, and is now a fully-fledged data project.
If you enjoy stats, charts, or extremely over-analysed mediocre Rocket League – hope you enjoy it.
Happy to answer questions / explain metrics / accept abuse for caring this much.
TL;DR
We play Rocket League every Sunday, track all our stats, aren’t very good, and turned three years of data into a Spotify Wrapped-style PDF. Ben is the best. Wooden Spoon = <100 points. This is what happens when nerds play car football.
by daveshow93
1 Comment
Source: Rocket League
Tool: R Studio & PowerPoint