Methodology: Data was collected from the Clery Act Annual Security Reports (ASRs) and/or public safety annual reports for the 2023 calendar year, aggregated as necessary. Where public reports were not available, data was obtained via public records requests (FOIA/state-level equivalents).
Student Enrollment:
Source: Institutional Research pages for each respective university and/or the National Center for Education Statistics (NCES) IPEDS data portal.
Methodology: Enrollment figures represent the Official Fall 2023 total student headcount (undergraduate and graduate) as reported by the institution.
Bubble Size (CCTV/Student Ratio):
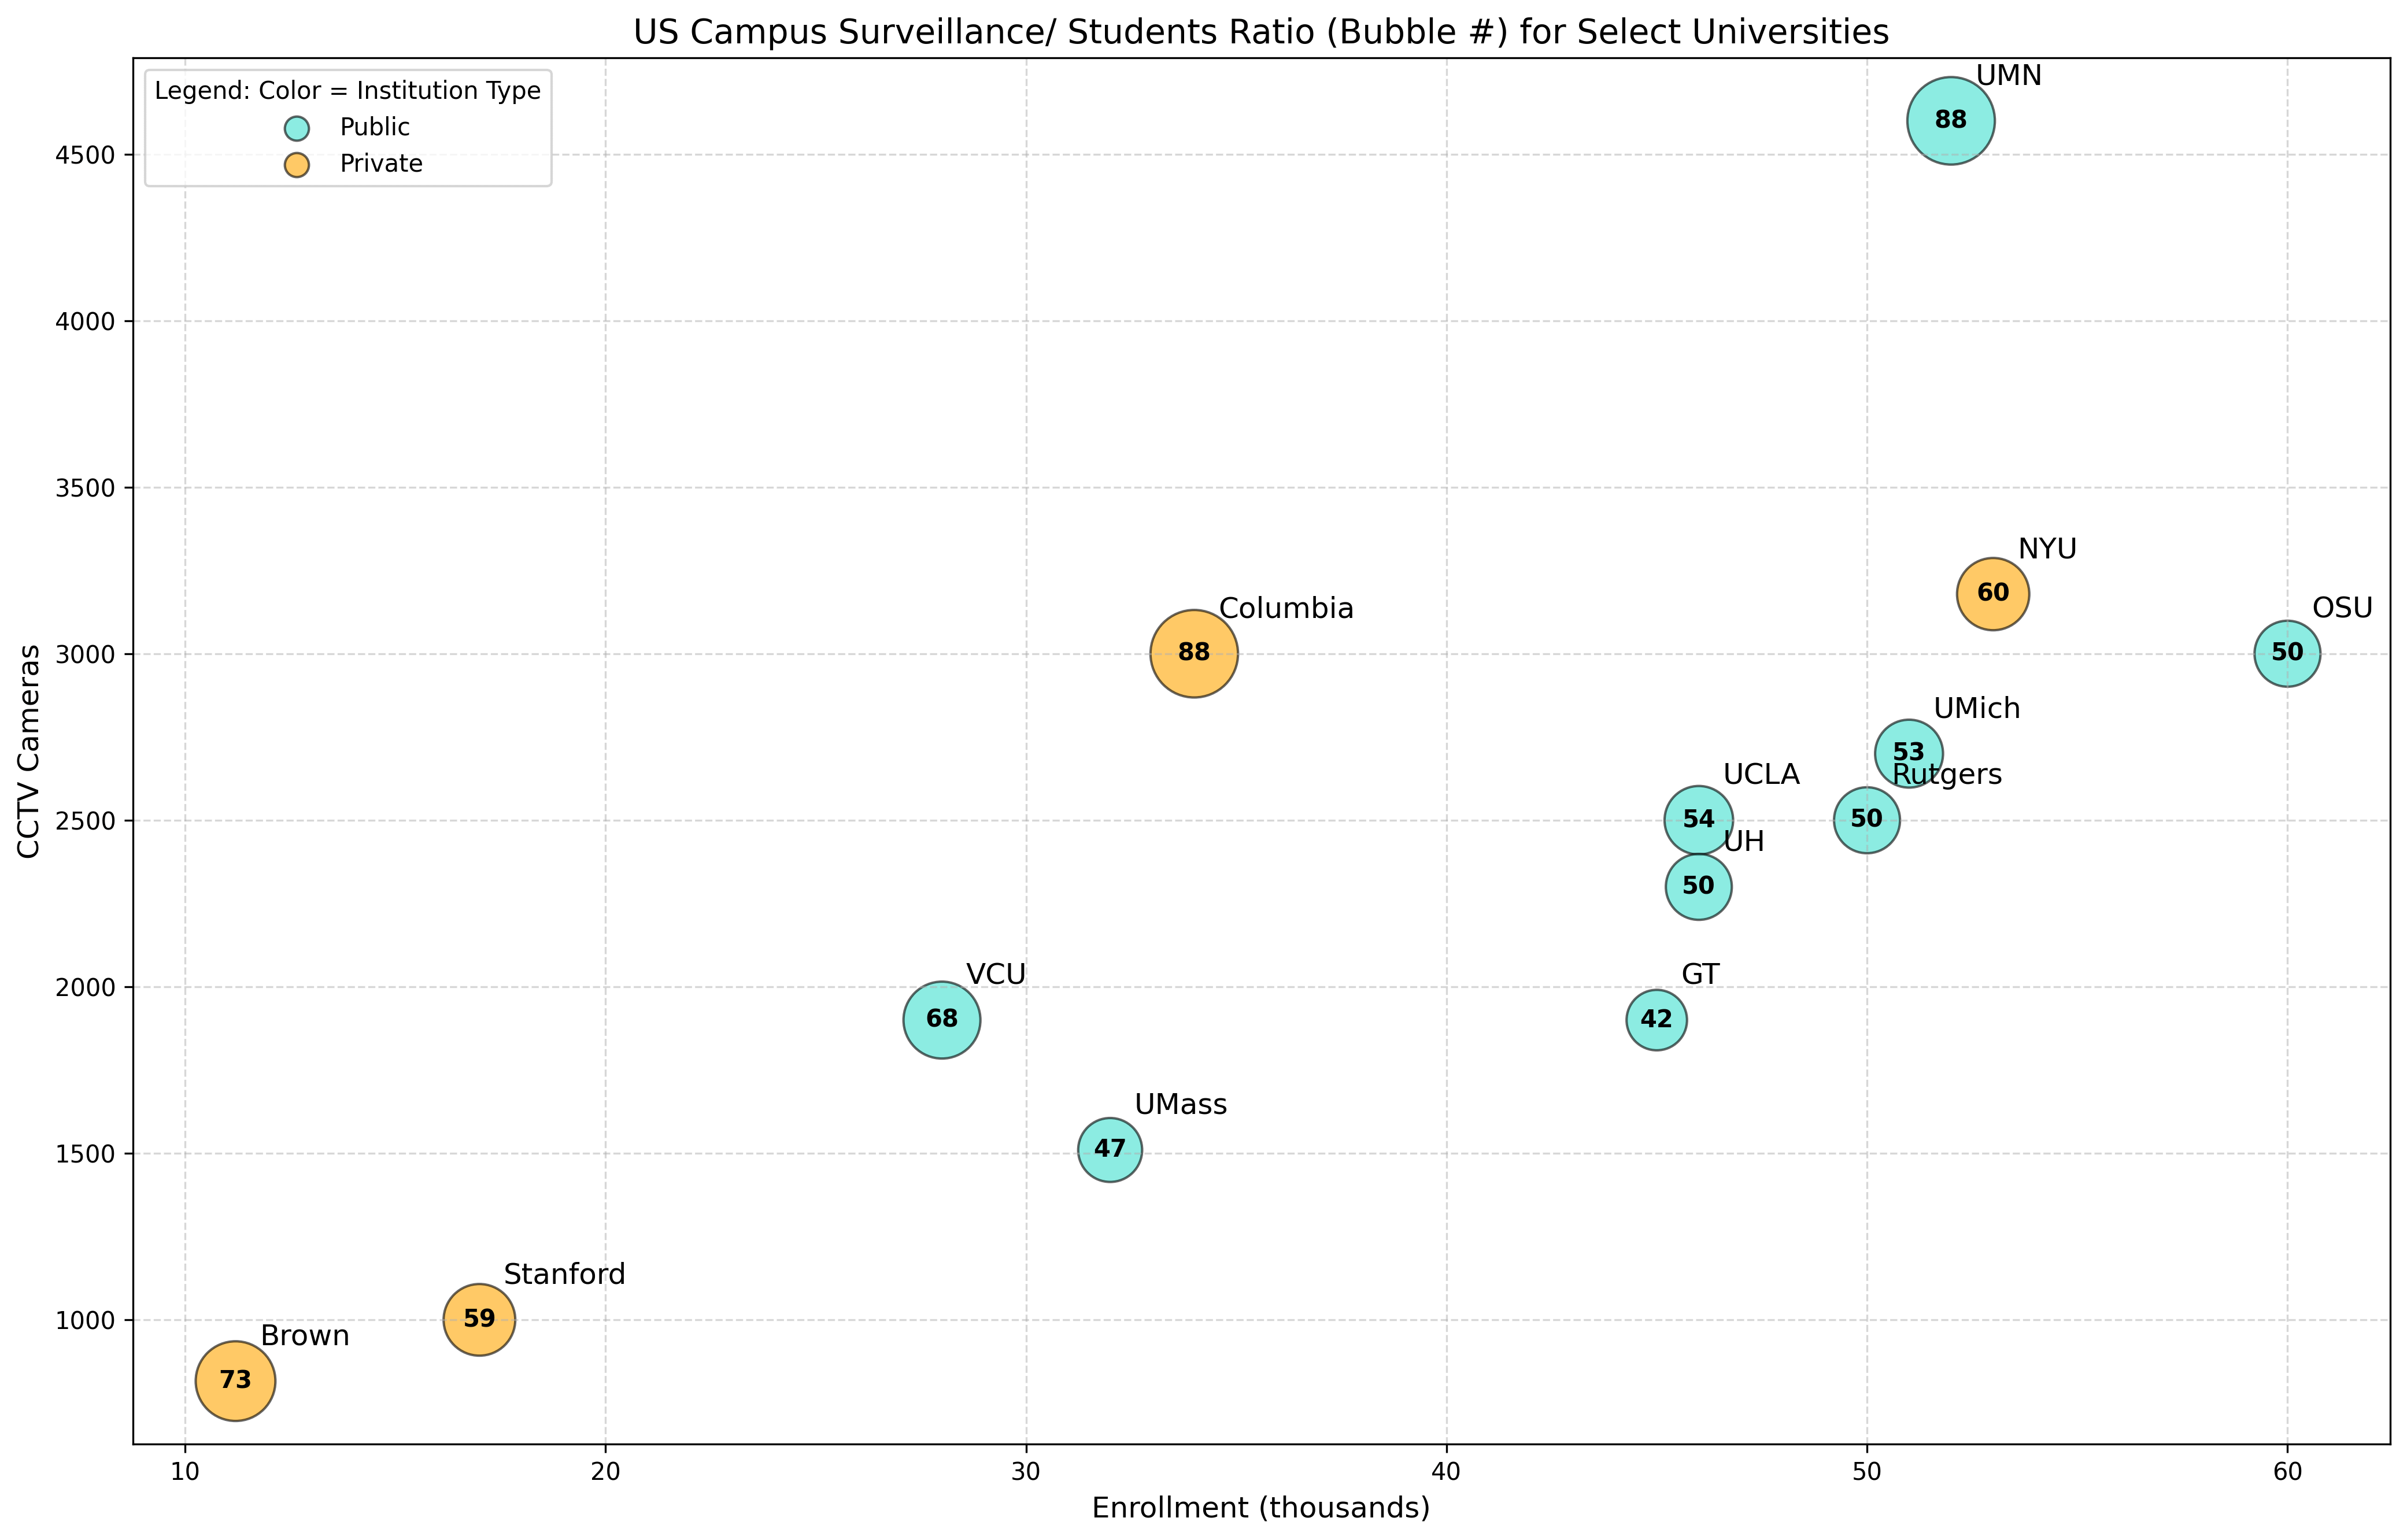
Calculation: Total CCTV Cameras / Enrollment (in thousands). The ratios are rounded to the nearest whole number for display.
Tools Used:
Data Analysis & Processing: Python (e.g., Pandas)
Visualization: Python (Matplotlib/Seaborn) and Thoughtbus (for final editing/annotation).
ryry013 on
It looks like the ratio doesn’t increase significantly, so I wonder if higher enrollment means more buildings, more classrooms, and therefore a higher requirement for more cameras.

2 Comments
Data & Tools Source:
Data Sources
Source: The Campus Safety Report 2024
Methodology: Data was collected from the Clery Act Annual Security Reports (ASRs) and/or public safety annual reports for the 2023 calendar year, aggregated as necessary. Where public reports were not available, data was obtained via public records requests (FOIA/state-level equivalents).
Student Enrollment:
Source: Institutional Research pages for each respective university and/or the National Center for Education Statistics (NCES) IPEDS data portal.
Methodology: Enrollment figures represent the Official Fall 2023 total student headcount (undergraduate and graduate) as reported by the institution.
Bubble Size (CCTV/Student Ratio):
Calculation: Total CCTV Cameras / Enrollment (in thousands). The ratios are rounded to the nearest whole number for display.
Tools Used:
Data Analysis & Processing: Python (e.g., Pandas)
Visualization: Python (Matplotlib/Seaborn) and Thoughtbus (for final editing/annotation).
It looks like the ratio doesn’t increase significantly, so I wonder if higher enrollment means more buildings, more classrooms, and therefore a higher requirement for more cameras.