[OC] Interactive visualization of the Catalan music ecosystem using Spotify data. It creates a galaxy of artists where you can explore and listen to their music.
[OC] Interactive visualization of the Catalan music ecosystem using Spotify data. It creates a galaxy of artists where you can explore and listen to their music.
Source: Data from Viasona.cat (Catalan music database) and the Spotify API.
Tools: AngularJS
Description:
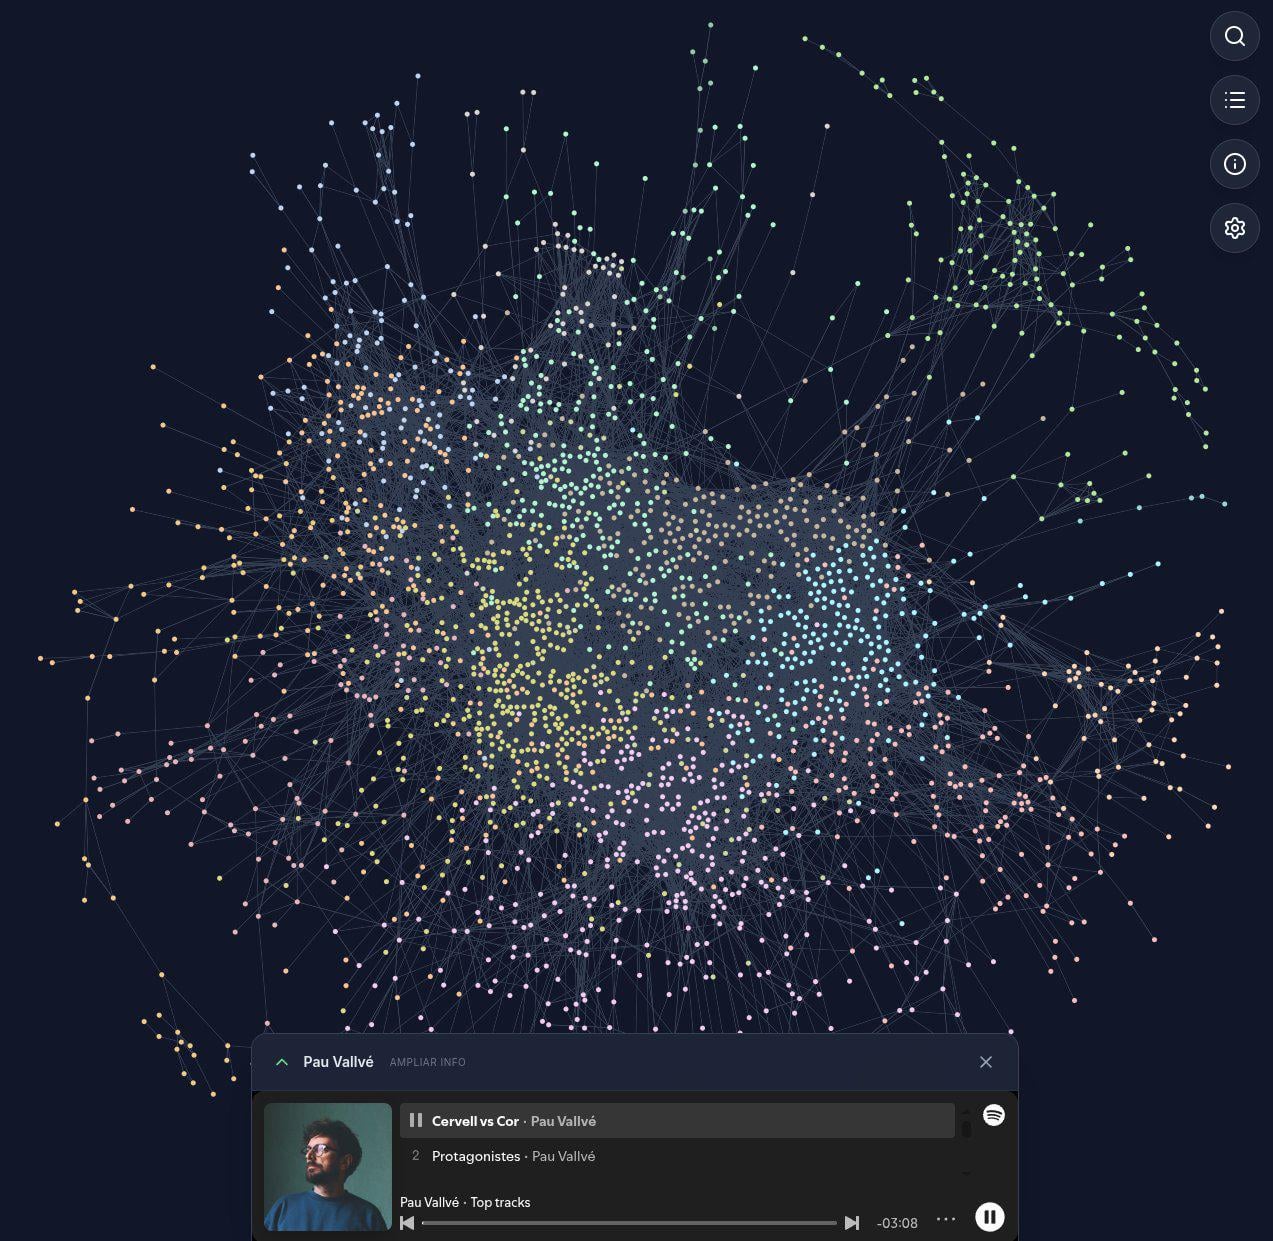
I built this experimental project to visualize the structure of the music scene in the Catalan language.
How it works: Each dot is an artist. The connections represent shared fanbases (based on Spotify’s “Fans also like” algorithm).
The Feature: It’s fully interactive. You can click on any node to listen to previews, view stats, and discover similar bands you might not know.
The Clusters: The algorithm groups artists based on listener affinity, naturally creating “musical neighborhoods” like Urban, Festive Pop-Rock, Folk, and Indie.
(Note: Some very small artists don’t appear because Spotify doesn’t provide “fans also like” data for them yet).

1 Comment
Source: Data from Viasona.cat (Catalan music database) and the Spotify API.
Tools: AngularJS
Description:
I built this experimental project to visualize the structure of the music scene in the Catalan language.
How it works: Each dot is an artist. The connections represent shared fanbases (based on Spotify’s “Fans also like” algorithm).
The Feature: It’s fully interactive. You can click on any node to listen to previews, view stats, and discover similar bands you might not know.
The Clusters: The algorithm groups artists based on listener affinity, naturally creating “musical neighborhoods” like Urban, Festive Pop-Rock, Folk, and Indie.
(Note: Some very small artists don’t appear because Spotify doesn’t provide “fans also like” data for them yet).
Link to the interactive map:
https://www.rogersanjaume.cat/apps/viasona/
Feedback is welcome!