
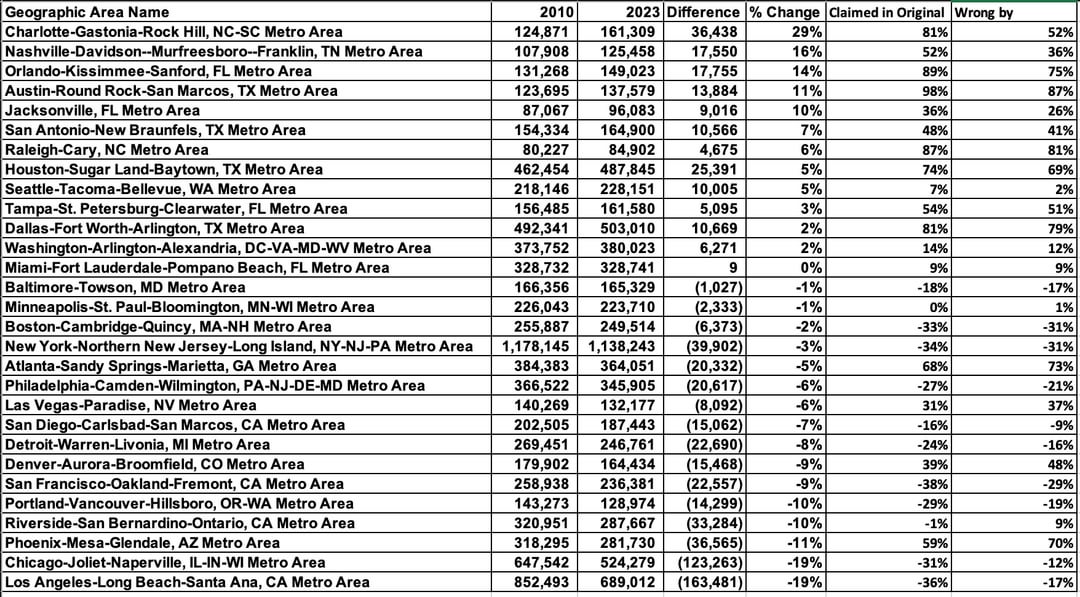
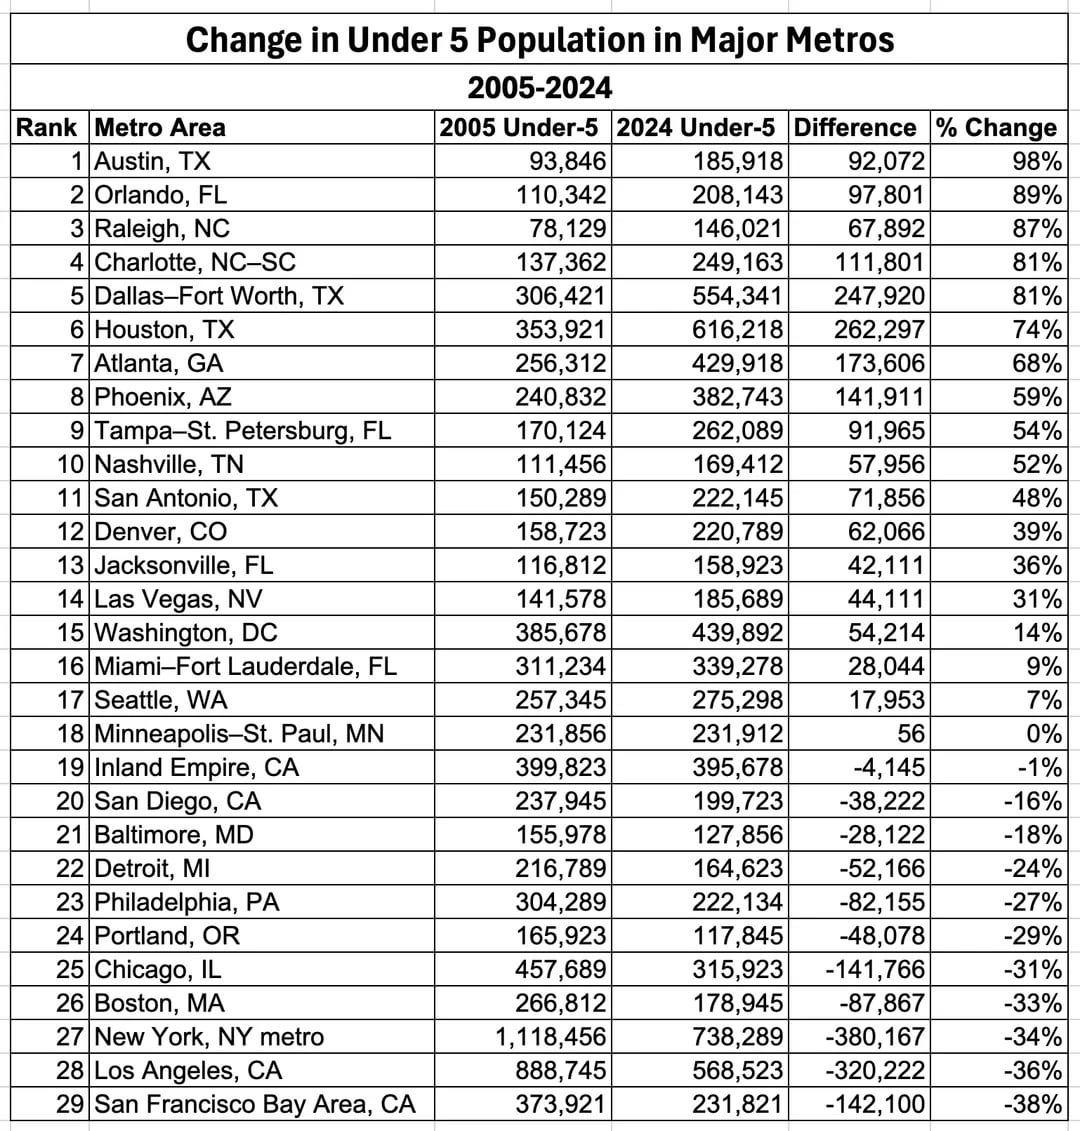
I saw the erroneous (2nd) chart pop up all over different reddit subs and on social media, and I can't believe how much traction it got despite having no source. (Here's the source for my chart, the first one: Link to Census data.) So many of the numbers aren't remotely believable: 98% increase in Austin; 81% in Dallas; 68% in Atlanta; 59% in Phoenix.
People are so quick to believe this kind of "data" without contemplating what you'd see if these shifts actually happened. E.g. Austin ISD + Charter enrollment dropped from 93,000 in 2011 to 88,000 in 2024: https://www.statesman.com/news/education/article/austin-isd-enrollment-drops-30-year-low-21112244.php
The article says "Austin’s child population has grown slightly", which could be managed through independent schools and neighboring districts. But a 92,072 increase in the number of kids under 5? With presumably similar growth among kids 5-9, you'd need so many new schools, and you'd definitely see a huge jump in enrollment.
Or the Bay Area (which is SF, Alameda, Marin, Contra Costa, and San Mateo counties; SJ is separate) having 373,921 kids in 2005, which would have been almost 9% of the entire metro, which is more than all but six congressional districts in 2012: https://www.census.gov/dataviz/visualizations/034/ (I realize the age pyramid has shifted, but if anyone thinks there's a metro with that many little kids, maybe you'd be interested in buying the Golden Gate Bridge from me.)
But in 2000, there were 254,909 kids under 5 (6.2%, data here: https://data.census.gov/table/DECENNIALSF12000.P012?g=050XX00US06001,06013,06041,06075,06081) and in 2010, there were 258,938 kids under 5 (6.1%, data here: https://data.census.gov/table/ACSST5Y2010.S0101?g=310XX00US12060,12420,12580,14460,16740,16980,19100,19740,19820,26420,27260,29820,31080,31100,33100,33460,34980,35620,36740,37980,38060,38900,39580,40140,41700,41740,41860,42660,45300,47900)
How could the number of kids under 5 go from 254,909 in 2000 to 373,921 in 2005 and then back down to 258,938 in 2010?
Or the 19M person NY metro losing 34% of its kids, implying a mass exodus of children not just in the five boroughs but throughout the suburbs. You'd be closing schools and shutting down little leagues everywhere. In reality, the number of kids went down 3.4%, which would be hard to see.
People were very dug in on the bad data. Surely using 2010-2023 (the current ACS data timeframe) must be ignoring precipitous declines and massive jumps from 2005-2010? Or that we don't see school closures because of something something funding politics?
I doubt any of the people who pushed back on me think they'd fall for ChatGPT nonsense or propaganda from some news channel. But they fell for this.
As they said on The Simpsons: "in accordance with your parents' wishes, you may step out into the hall and pray for our souls,"
by dmg1111
2 Comments
Thanks for doing some real work!
A fucking spreadsheet on /r/dataisbeautiful lmao