
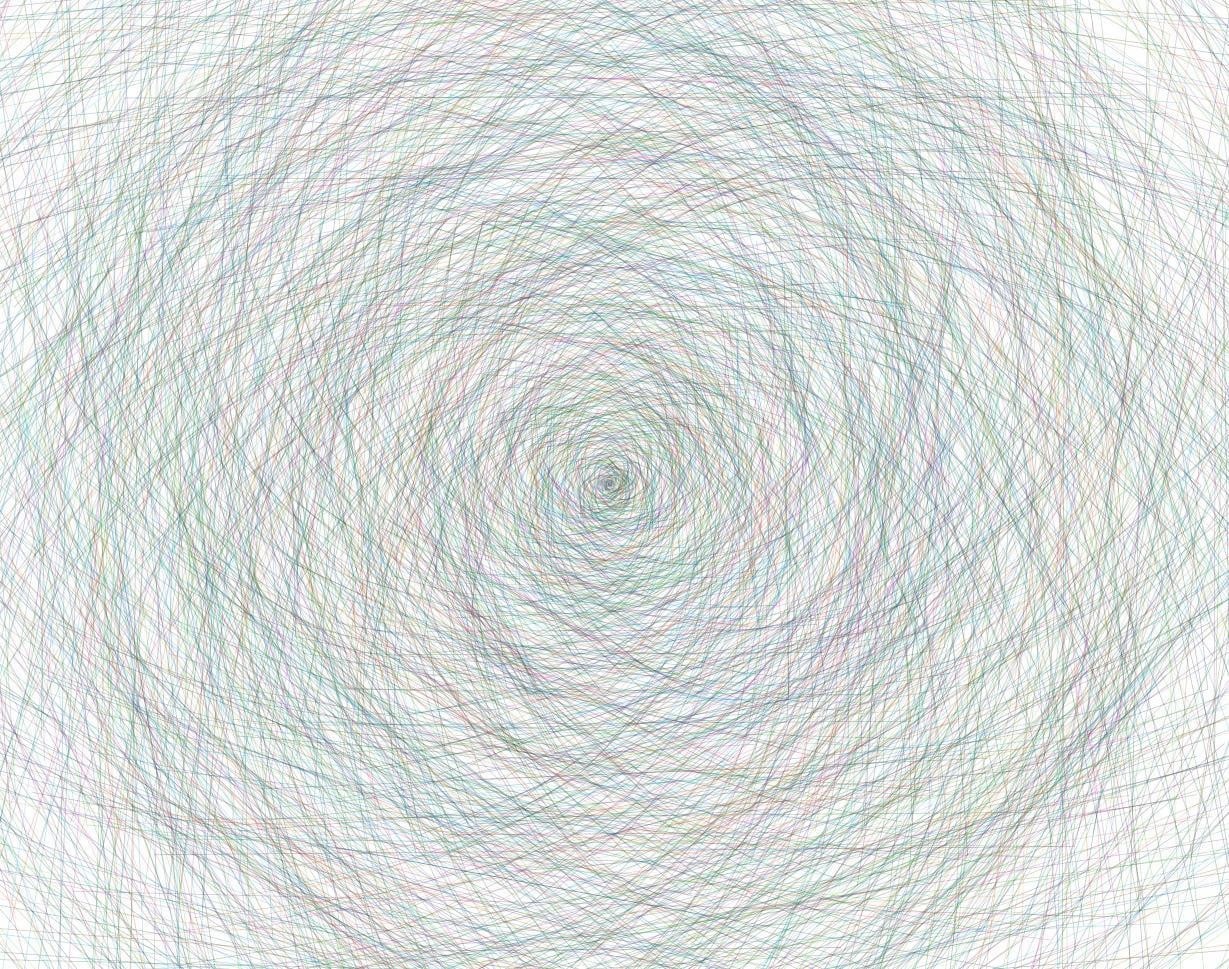
I’m continuing with learning number theory, this plot is prime numbers, but plotted in an unusual way.
Take Mod k6 ± 1 (which removes the noise from 2,3 and their products) and then from that, take all residuals Mod k35 (5•7) – then plot in polar coordinates – crucially, draw a straight line on each residual until there is a gap. So multiple lines per Mod k6 residual, plotting the strings of primes. Where there is a gap, stop plotting.
This is all just straight lines. It’s mathematically related to the famous Ulam Spirals
This is plotted out to 200001.
My brain, although I plotted it, can’t not see the topology of prime numbers.
Simply Excel xx scatter chart, nothing funky, just straight lines using Microsoft default palettes on Windows.
by RandomiseUsr0
3 Comments
Why isn’t the background flat? It’s impossible to see what’s going on due to the shadows.
If it’s due to overlapping data causing the appearance of shadows, please post a higher resolution image later.
I dunno what this is… is it data?
I’ve nothing really to add, it’s an Excel straight line xy scatter plot of primes in Mod k35 residuals, stopping where a gap is detected (which is default Excel behaviour) – plotted in polar coordinates by taking each residual as its own series and then applying straightforward cos for the x and sin for the y
The spiral is created by applying floor.math of each number in turn, I will write it out as a single Excel formula tomorrow if anyone wants to play along.