

Source: https://www.gov.uk/government/statistical-data-sets
Hi all,
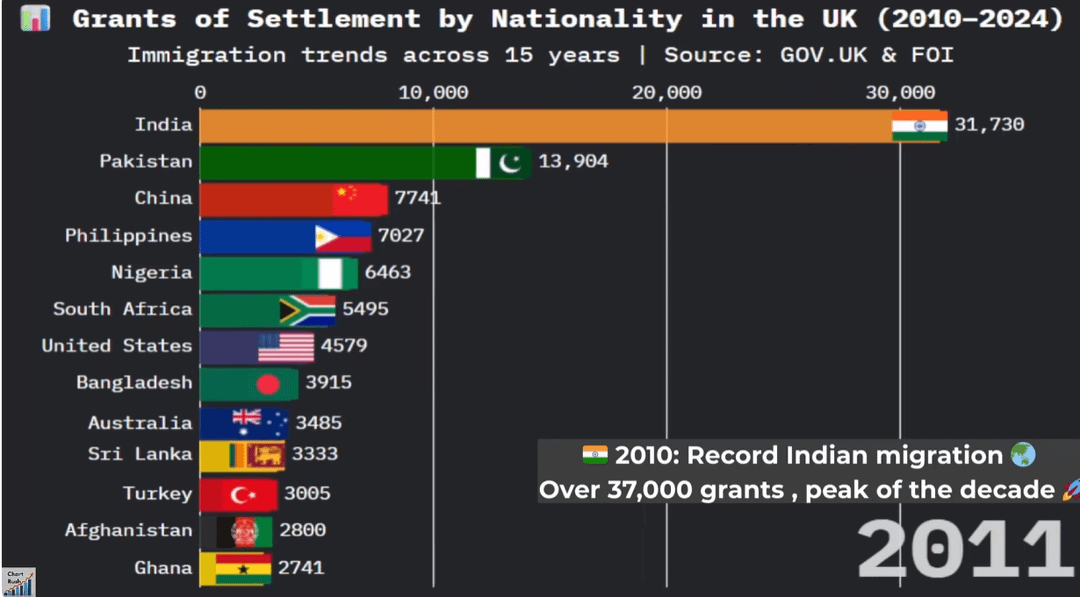
I put together a bar chart race visualising UK immigration data from 2010 to 2024, looking specifically at grants of settlement by nationality. The data is taken directly from the Home Office release tables and covers year by year changes across the period.
It is not political commentary, just a visual breakdown of how different nationalities moved up and down over time. I enjoy turning government datasets into clean animations, so I wanted to share it here for anyone interested in long term trends.
Source used: Home Office Immigration Statistics (Settlement datasets).
Happy to answer questions about how it was made or where the data comes from.
Video here if anyone interested – https://www.youtube.com/watch?v=JPNeAtdaG4c
by True_Ad793
2 Comments
Presuming you meant to put 2024 on the second slide?
So beautiful you posted it twice