

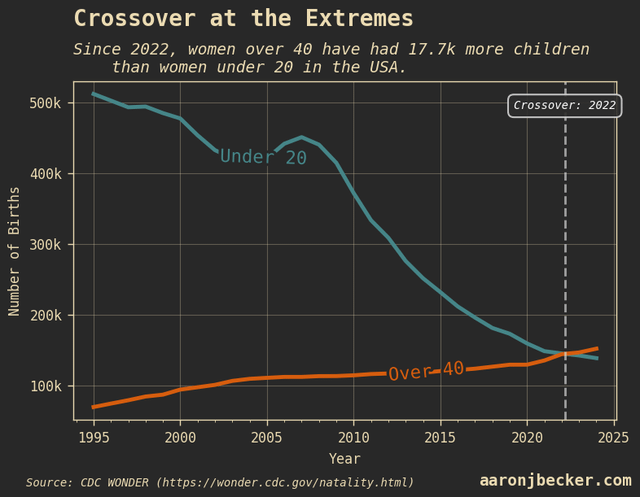
Working inward from the extremes, every maternal age group has swapped places in the last 8 years (e.g. 40+ and < 20, 20-24 and 35-39…). Blog post with code and CSV data links: https://aaronjbecker.com/posts/thirties-are-the-new-twenties-us-births-by-maternal-age-group/
by aar0nbecker
4 Comments
Data source: [CDC WONDER data portal](https://wonder.cdc.gov/natality.html), 3 separate queries (1995-2002, 2003-2006, 2007-2024)
Tools: python, matplotlib
I just discovered the [matplotlib-label-lines package](https://github.com/cphyc/matplotlib-label-lines); it’s easy to use and produces nice results, highly recommended.
[Blog post with visualization code (nothing that fancy this time, just a line plot) and links to download the CSV data](https://aaronjbecker.com/posts/thirties-are-the-new-twenties-us-births-by-maternal-age-group/) so you don’t have to use the WONDER query tool.
Seems pretty awesome to me
thank god cuz my twenties are not going how i wanted them to 💀
How’s the correlation to autism incidence?