
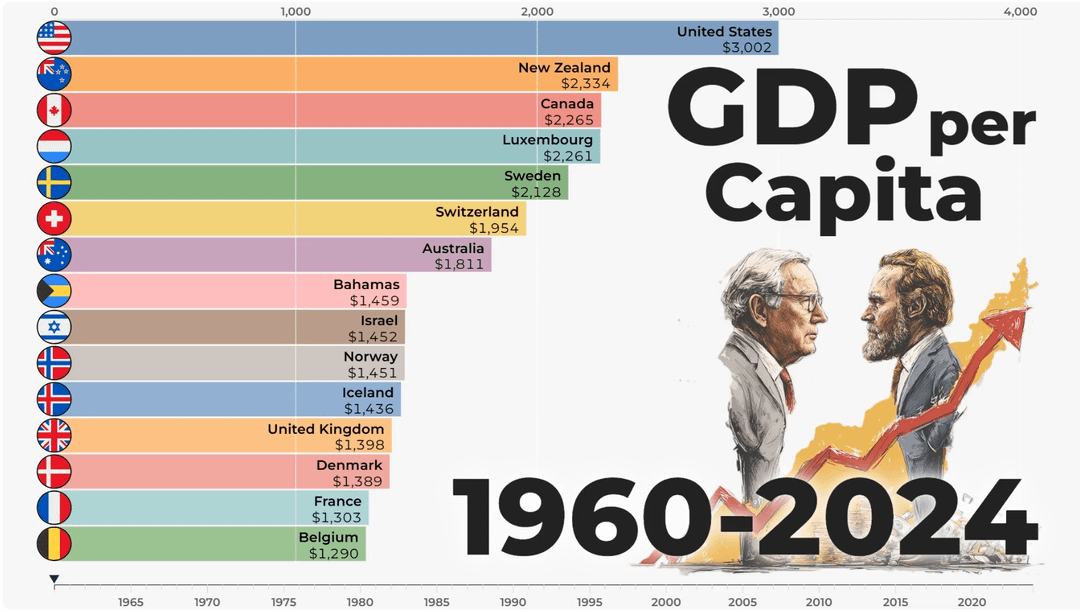
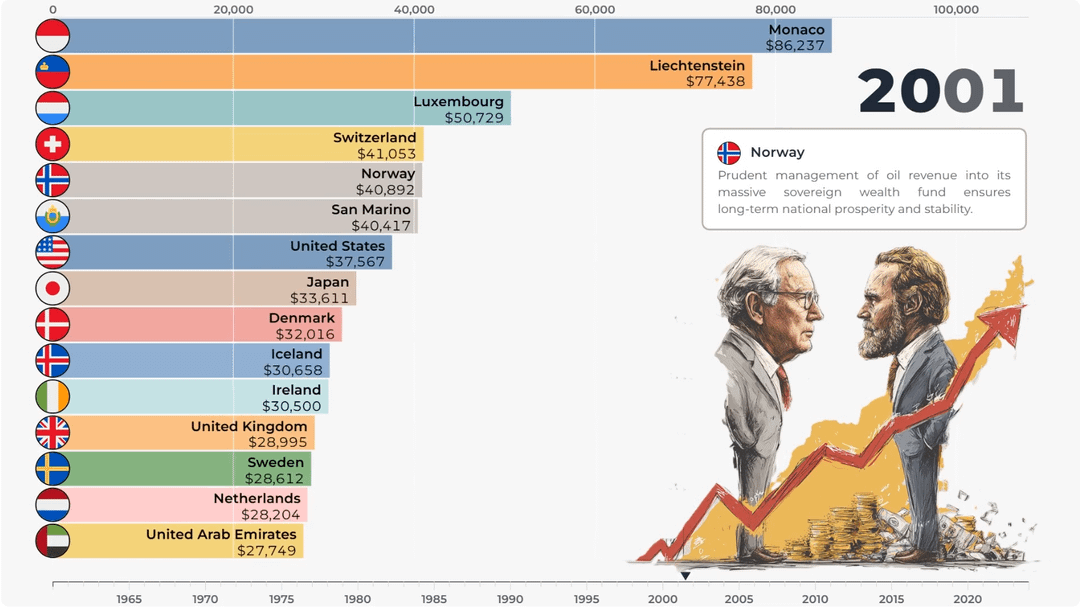
I've created an animated visualization showing 64 years of global wealth transformation. The animation reveals significant changes in country rankings, from oil boom stories to pandemic-era growth patterns.
Data source: World Bank GDP per capita data (1960-2024)
Tools used: Own Web App in React + D3.js
Video: YouTube Video Link
The visualization uses smooth transitions to show how economic power shifted between nations over six decades.
by Relevant_County_5280