
What is this?
This is a toy dataset with five independent linear relationships — z = ax. The nature of this relationship i.e. the slope a, is dependent on another variable y.
Or simply, this is a minimal example of many local relationships spread across the space — a "compositional" relationship.
How could neural networks model this?
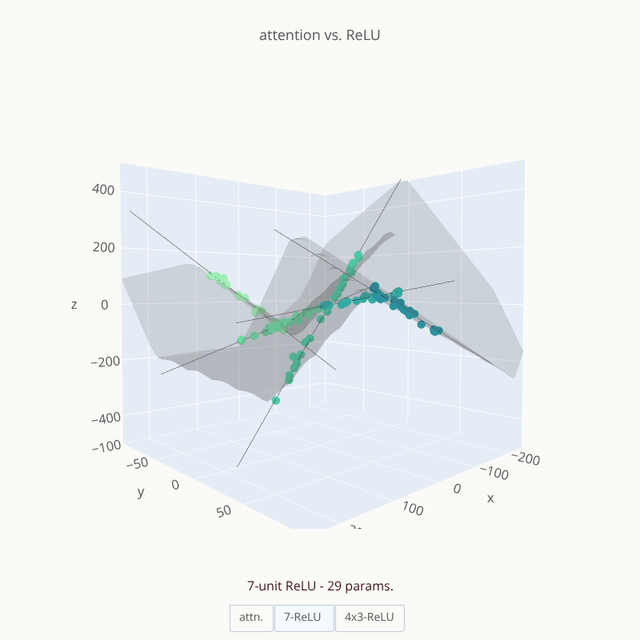
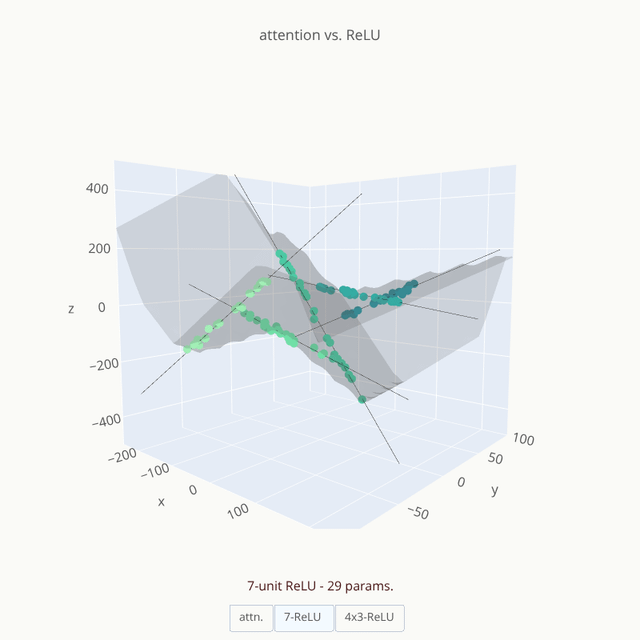
- Feed forward networks with "non-linear" activations
- Each unit is typically a "linear" function with a "non-linear" activation —
z = w₁x₁ + w₂x₂ ..& if ReLU is used,y = max(z, 0) - Subsequent units use these as inputs & repeat the process — capturing only "additive" interactions between the original inputs.
- Eg: for a unit in the 2nd layer,
f(.) = w₂₁ * max(w₁x₁ + w₂x₂ .., 0)… — notice how you won't find multiplicative interactions like x₁ * x₂ - Result is a "piece-wise" composition — the visualization shows all observed data points covered through a combination of planes (linear because of ReLU).
- Each unit is typically a "linear" function with a "non-linear" activation —
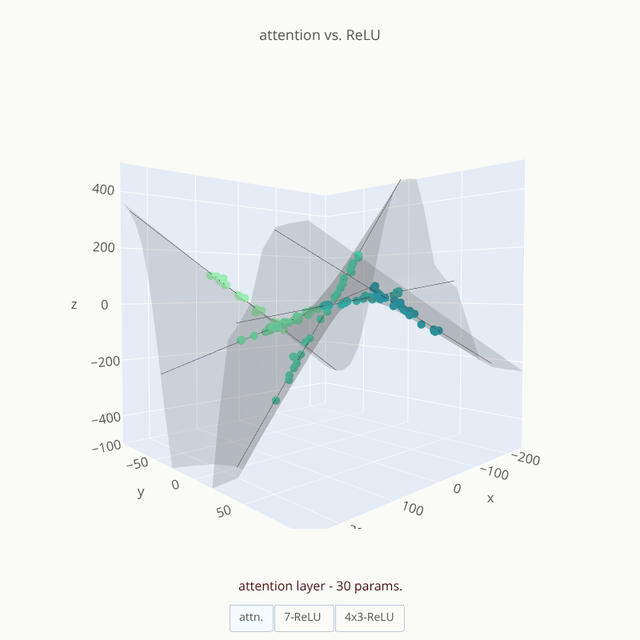
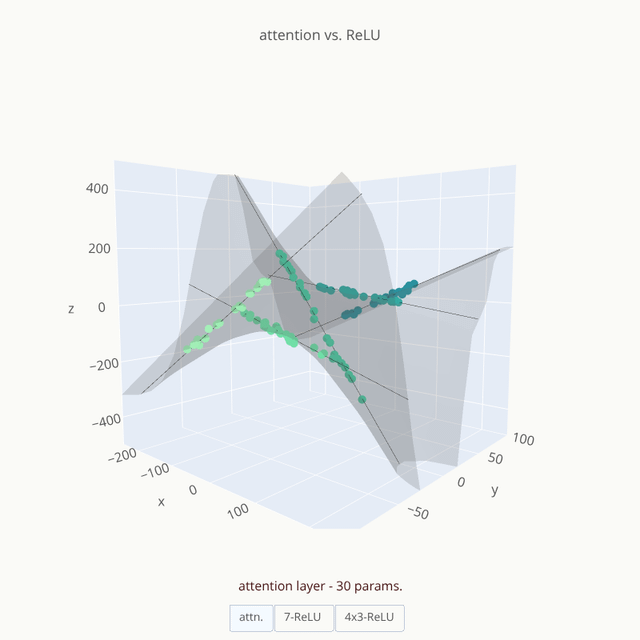
- Neural Networks with an "attention" layer
- At it's simplest, the "linear" function remains as-is but is multiplied by "attention weights" i.e
z = w₁x₁ + w₂x₂andy = α * z - Since these "attention weights"
αare themselves functions of the input, you now capture "multiplicative interactions" between them i.esoftmax(wₐ₁x₁ + wₐ₂x₂..) * (w₁x₁ + ..)— a high-order polynomial - Further, since attention weights are passed through a "soft-max", the weights exhibit a "picking" or when softer, "mixing" behavior — favoring few over many.
- This creates a "division of labor" and lets the linear functions stay as-is while the attention layer toggles between them using the higher-order variable
y - Result is an external "control" leaving the underlying "true" relationship as-is.
- At it's simplest, the "linear" function remains as-is but is multiplied by "attention weights" i.e
This is an excerpt from my longer blog post – Attention in Neural Networks from Scratch where I use a more intuitive example like cooking rice to explain intuitions behind attention and other basic ML concepts leading up to it.
These are screenshots, the full visualization is a plotly-interactive. x-post from r/learnmachinelearning
Disclaimer: unsure if this is a fit for this sub since this is not real data. Mods, feel free to remove it if not.
by hayAbhay