
Source datasets [1] [2] [3] [4]
Created with MOSTLY AI. You can modify and explore the visualization above.
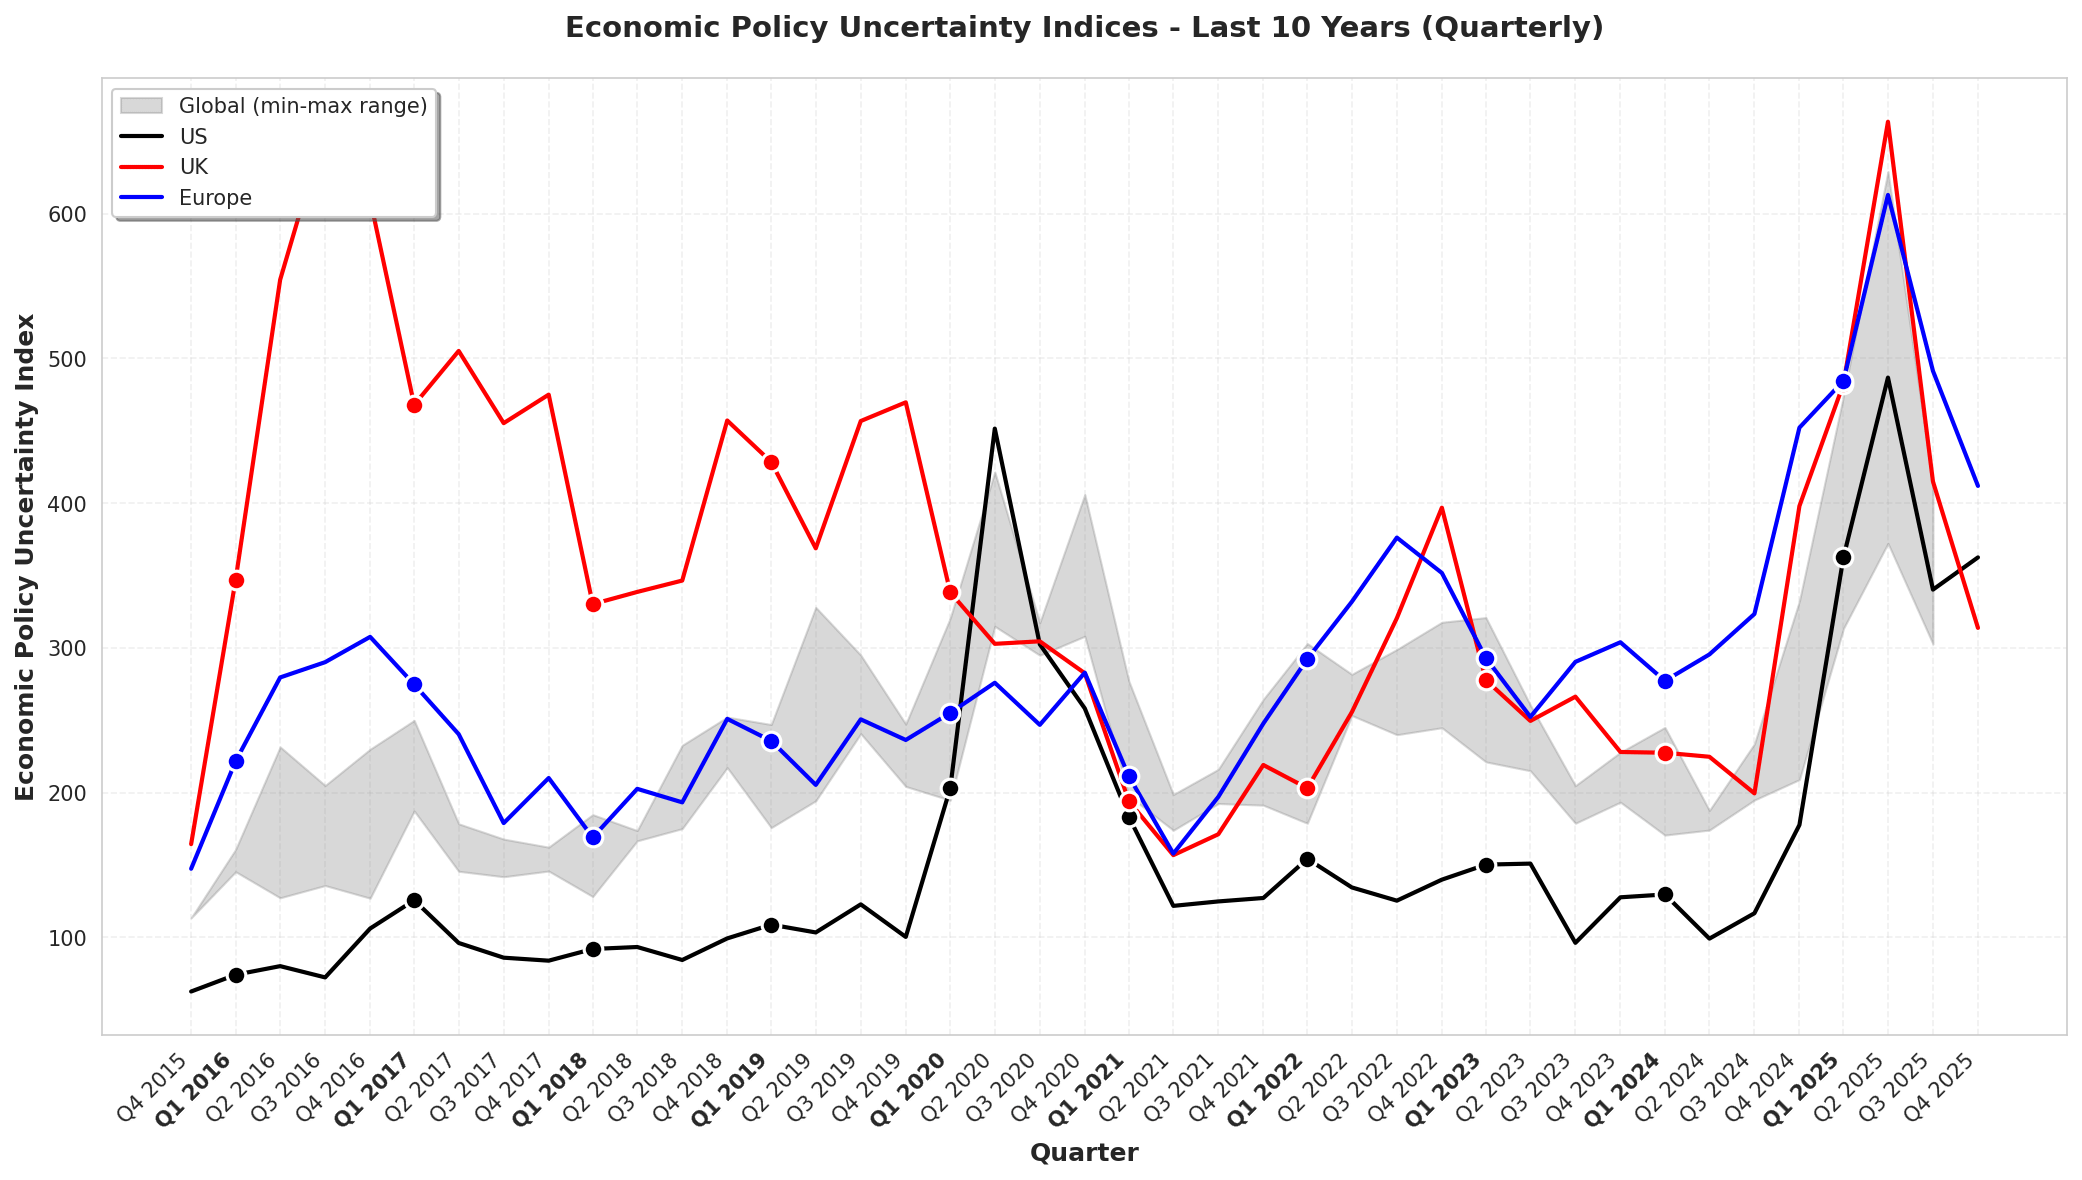
Overview
This visualization tracks Economic Policy Uncertainty (EPU) indices across multiple regions over the past decade, aggregated by quarter to reduce noise and reveal broader trends.
What the Chart Shows
The chart displays four EPU measures:
- Global EPU (gray shaded area): Shows the minimum-maximum range for each quarter, representing the spread of policy uncertainty across countries worldwide
- US EPU (black line): United States Economic Policy Uncertainty Index
- UK EPU (red line): United Kingdom Economic Policy Uncertainty Index
- Europe EPU (blue line): European Economic Policy Uncertainty Index
Bold Q1 labels and circular markers highlight the first quarter of each year for easy year-over-year comparison.
Key Insights
The data reveals several notable patterns:
- Brexit Impact (2016): The UK experienced a dramatic spike in policy uncertainty following the June 2016 Brexit referendum, with the index jumping from around 350 to over 650
- COVID-19 Pandemic (2020): All regions showed sharp increases in uncertainty during Q1-Q2 2020, with the UK and Europe reaching levels comparable to the Brexit period
- Regional Divergence: The UK and Europe consistently show higher volatility and absolute uncertainty levels compared to the US
- Recent Stabilization: Post-2020, uncertainty levels have generally declined across all regions, though they remain elevated compared to pre-2016 levels
- US Stability: The US index remains relatively stable throughout the period, typically ranging between 100-200, with notable exceptions during major political events and the pandemic
by SyllabubNo626
4 Comments
Source datasets [[1](https://fred.stlouisfed.org/series/GEPUCURRENT)] [[2](https://fred.stlouisfed.org/series/USEPUINDXD)] [[3](https://fred.stlouisfed.org/series/UKEPUINDXM)] [[4](https://fred.stlouisfed.org/series/EUEPUINDXM)]
Created with [MOSTLY AI](http://app.mostly.ai). You can [modify and explore the visualization above](https://app.mostly.ai/artifacts/6563804d-ea82-4666-81ac-ef825d4e98ee).
seems like we still have not recovered from covid
None of the economic data coming out from the government can be trusted. They have fired almost everyone who reports and installed partisans.
I mean yeah, I liquidated my stocks and shares ISA this week. Not as to beat the market or anything, but because I’d rather miss out on making a couple more grand next year than risk losing a bunch of money during an economic crisis.