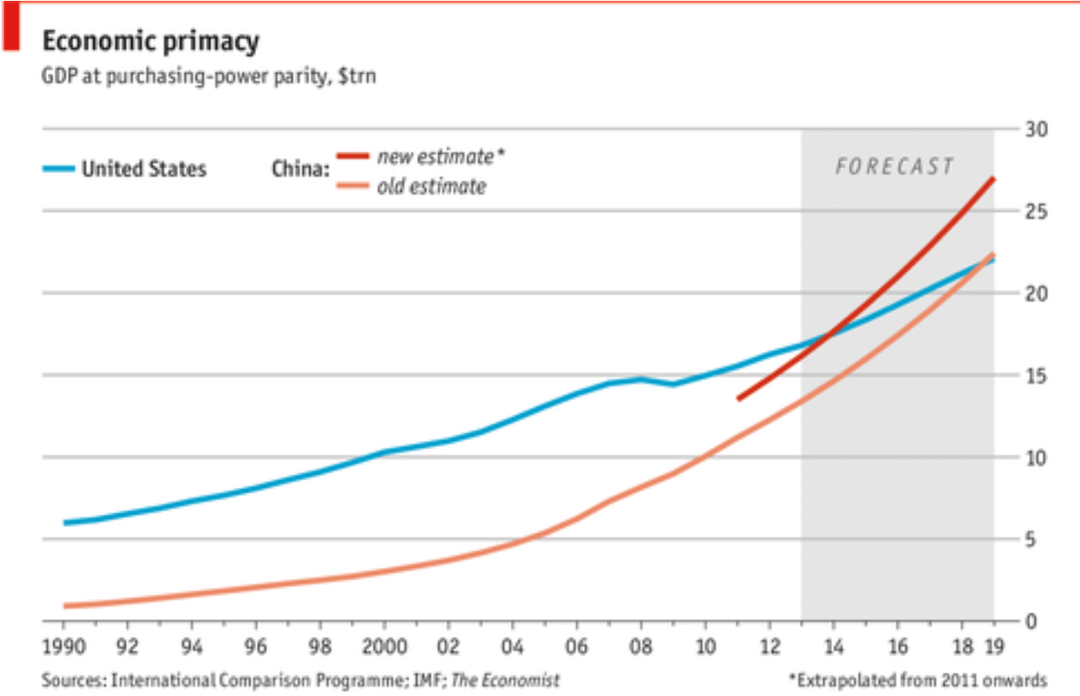
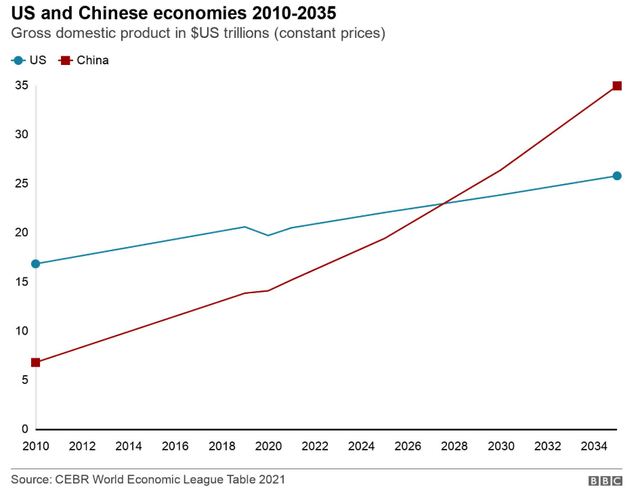
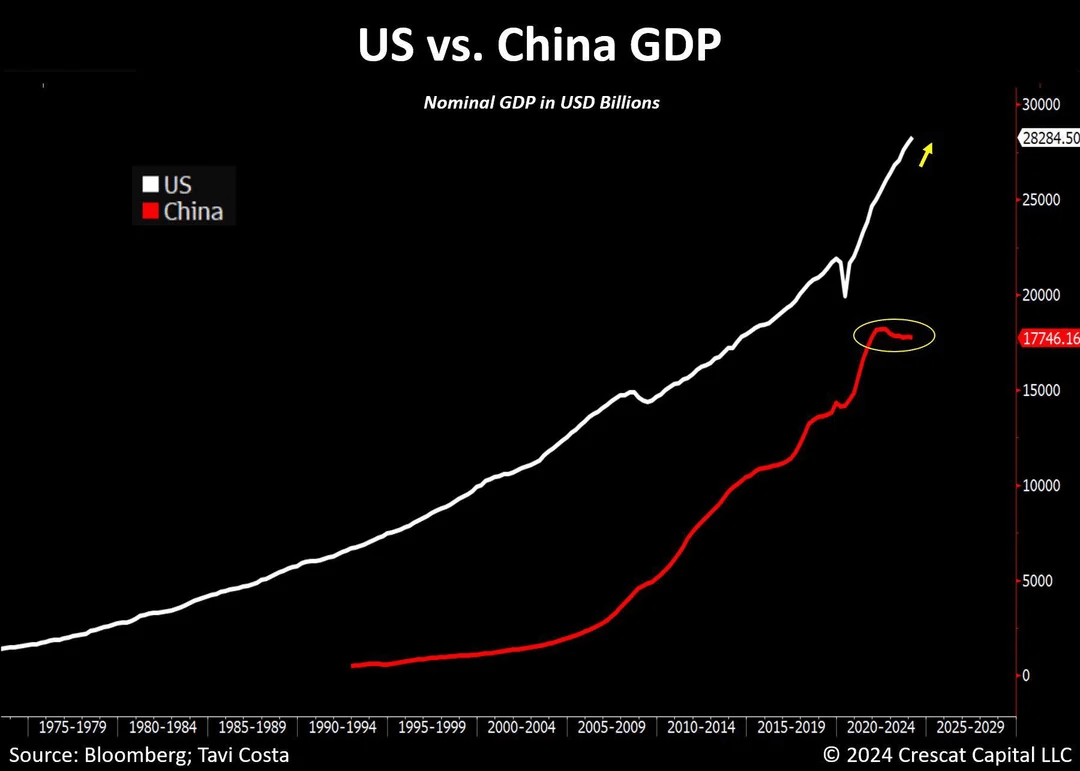
MolybdenumIsMoney on November 6, 2025 7:26 am The first graph is GDP adjusted for purchasing power parity, where China has been ahead for a decade now. The latter two graphs are nominal GDP.

3 Comments
The first graph is GDP adjusted for purchasing power parity, where China has been ahead for a decade now. The latter two graphs are nominal GDP.
These are 3 different sources?? This doesn’t seem trustworthy
What’s causing the 2024 ‘flatlining’ (third image)?