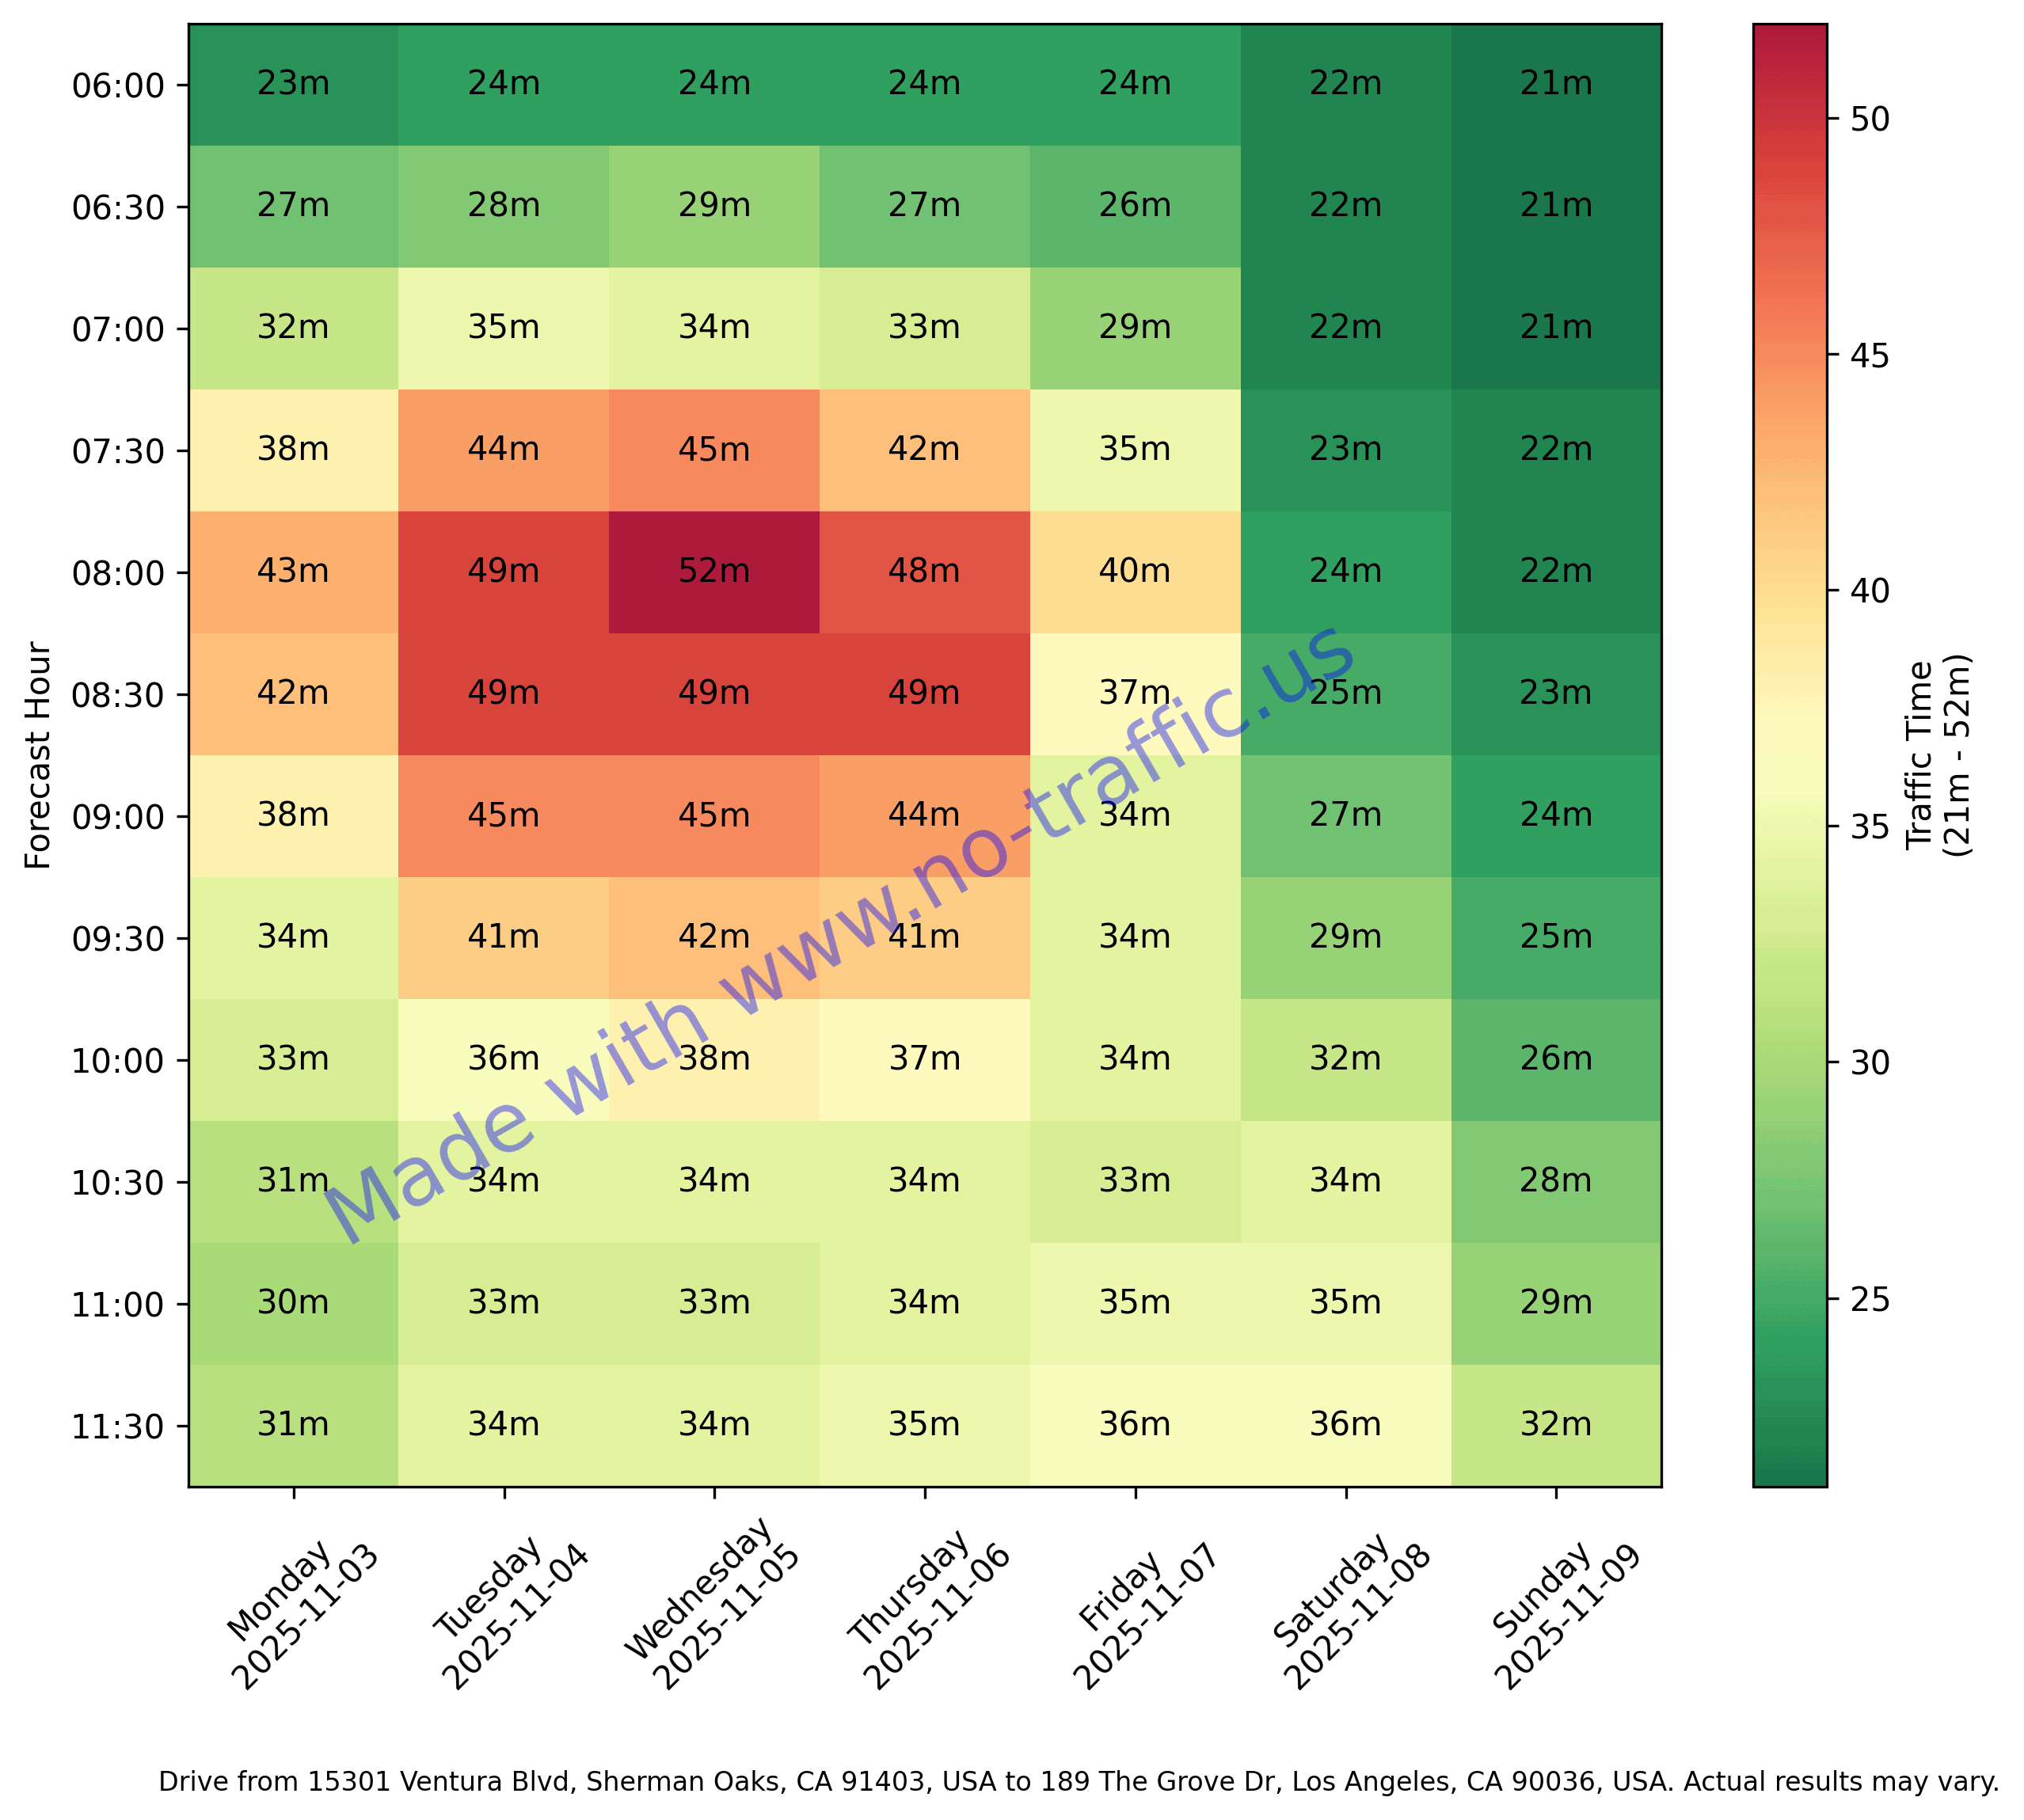
[OC] I Analyzed Morning Traffic Patterns in Los Angeles
I put together a little Python script to chart out how LA traffic builds up through the morning. It’s weirdly satisfying watching rush hour turn into data.
Traffic data is from Google Maps API. The tool is available for everyone.

3 Comments
Am I trippin or is this data supposed to be for NEXT week?
Everytime I c a chart like this I just assume it’s the Game of Thrones episode rankings
Really interesting analysis of part-time and work from home patterns. People are in the office on Wednesday!