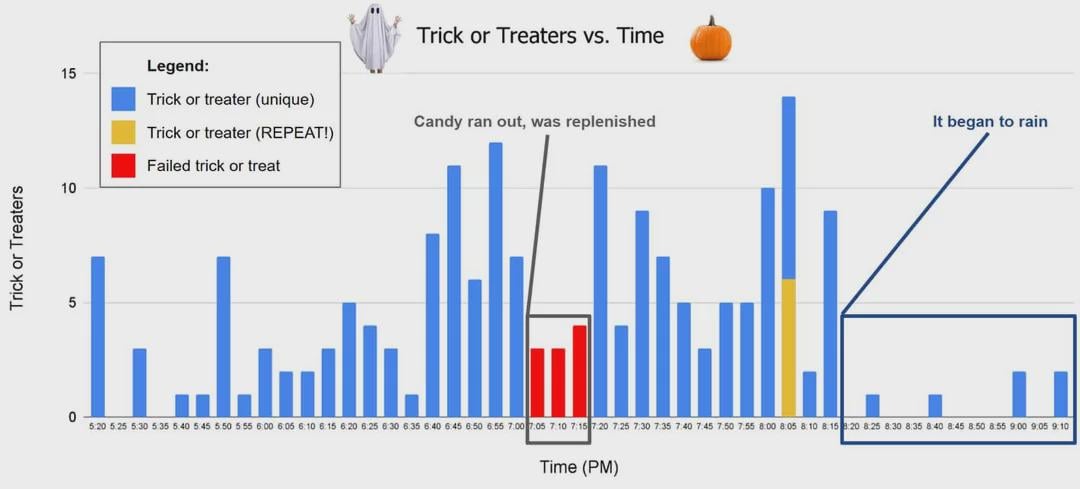
We're one day away from Hallowe'en, and I thought it would be fun to share the results of last year's Trick or Treater numbers in a histogram format. It was remarkably busy!
I will be looking to update this over the weekend to provide a year over year comparison so stay tuned!
by Timely-Macaron268

6 Comments
**Source:** Good old fashioned observational data recorded with pen & paper
**Analysis Method:** Microsoft Excel Chart
The “Failed trick or treat” part in the legend gave me a good chuckle (and the [REPEAT!])
Good luck with the candy this year!
Cool, I can’t remember the last time my neighborhood had any ToT’ers since everyone does the trunk thing now. Probably before the pandemic even.
Damn you guys were busy. We usually get 10-15 each year
Identifying repeaters is very impressive.
it seems like you’re in one of those places where people can just trick or treat whenever they feel like it? my local community has a set 2 hour window for trick or treating in order to try to have it during daylight hours.