Tool: Excel, source: my personal blood test data
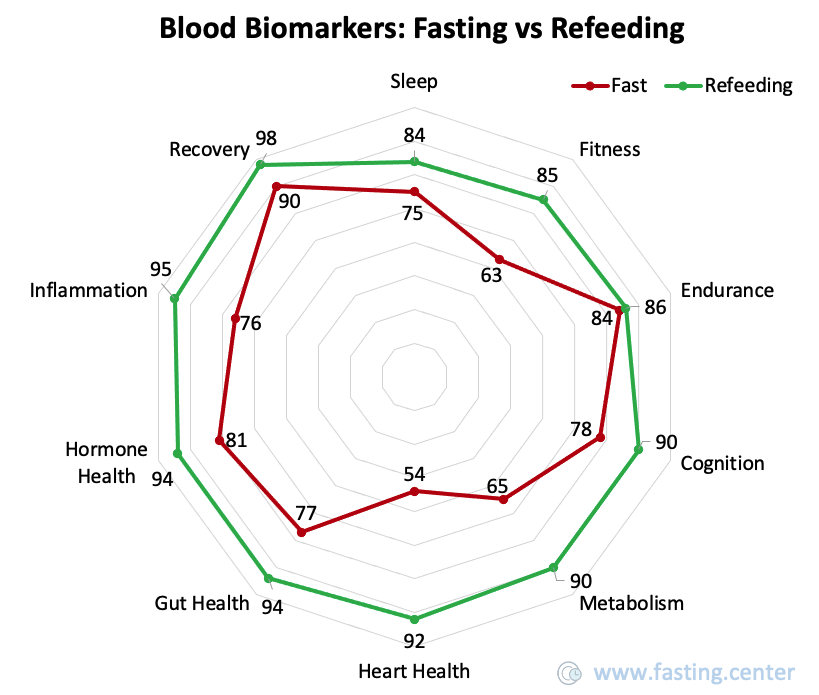
Hey folks! Here’s how my blood biomarkers categories changed between the last day of my recent 10-day water fast (Sep 4) and about one month after refeeding (Oct 14).
Each category like Heart Health, Hormone Health, or Inflammation combines several related blood markers and calculates a 0-100 (100 = super) score based on how close each marker is to its optimal clinical range. For example, Heart Health includes ApoB, HDL, LDL, hsCRP and other biomarkers. Hormone Health incorporates testosterone, TSH, SHBG, and other hormones.
An extended fast is a stress for the body, so most biomarker categories dropped during fasting. After a month of refeeding, nearly all systems rebounded, with 7 out of 10 improving beyond their pre-fast levels.
by andtitov

7 Comments
On the 0-100 scale, what is the optimum level? Or is it “higher is better”?
It is kind of interesting, but without numbers from before the fast it seems kind of impossible to come to any conclusion aside from fasting is hard on a lot of these measured values.
Wouldn’t it make more sense to show the values of the markers themselves rather than an interpretation of them?
This really needs the pre-fast data to be more informative, in my opinion. Now it’s just like “your body hates it when you don’t eat for 10 days and eventually you’ll die” 😀
Also a fourth one 6 months after the refeeding would be interesting too.
This is not data. This is a horoscope. There’s no such thing as a Cognition Blood Biomarker.
Useful chart to show the harms of fasting, although it would be good to see the individual markers rather than broad fairly vague categories.
It’s interesting, but not “beautiful”. WAY too much explanation is needed to figure out what’s being reported here.
Combining several categories into single categories, and then not explaining what those categories are, then makes it more opinion than fact.