
Reposting, because the previous thread was deleted (wrong posting day, which I though was a joke, but apparently not – sorry Mods!)
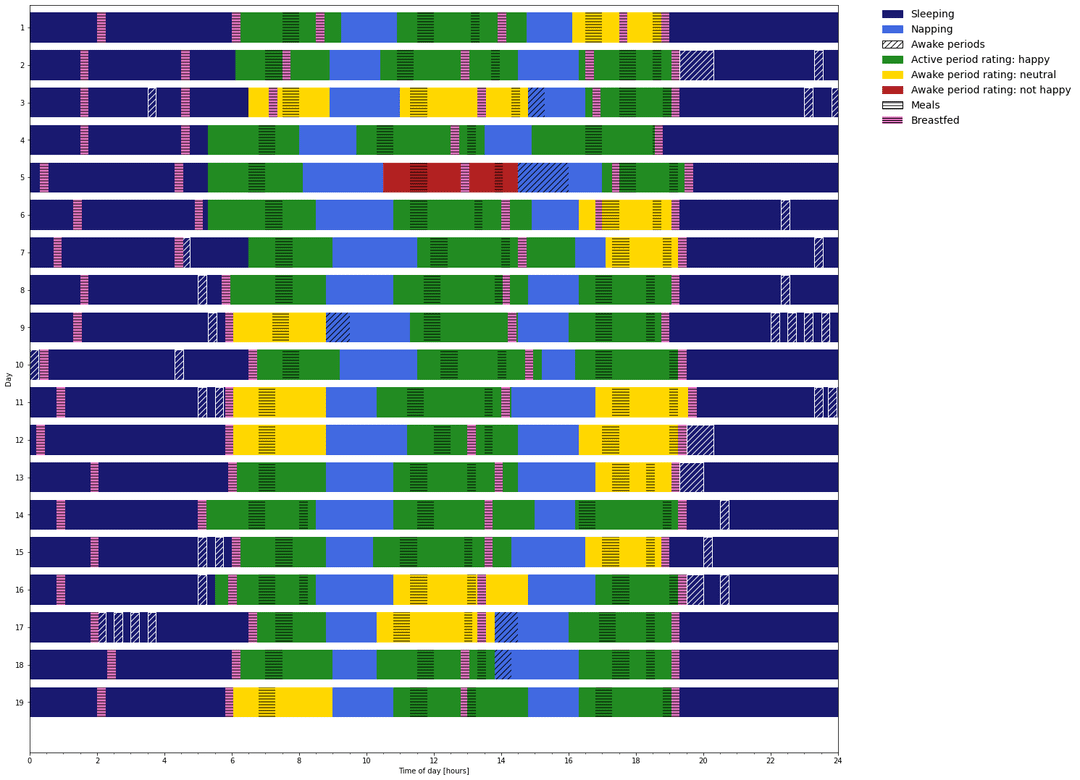
I have been noting down some details of the day of my 10-month old. It takes few minutes every day, and it starts to look like a nice dataset to plot. I have received some good feedback just before the previous post was deleted, and the new graphs include some small changes because of that.
Some explanations:
- All main meals and snacks are set to the same duration (30 and 15 min, respectively), as this is the approximate average of the time to feed this little monster.
- Awake periods during the night get automatically 15 min, unless they last longer than that.
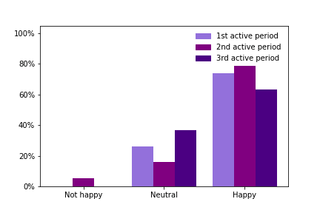
- Mood rating is very subjective, I know, but I try to keep it simple with a three level rating.
All plots made with matplotlib or seaborn, and data comes from… my offspring!
Let me know your thoughts/comments. As I mentioned, I have now few weeks of data, and I am planning to continue this little project throughout my parental leave.
by drboomer123
5 Comments
Three poops a day?! How much fiber you doing? I usually just take one big one a day. If I take two poops before work and feel there’s a third in the works I’m calling out.
It’s cool that your 10 Month old could already tell you if they’re happy or not
How the fuck did you even have the time to do this.
Nice sleep to breastfeed ratio! Mine still wakes up almost every two hours, even though she’s two years old. Truly, all kids are different.
You and my brother-in-law would get along.