
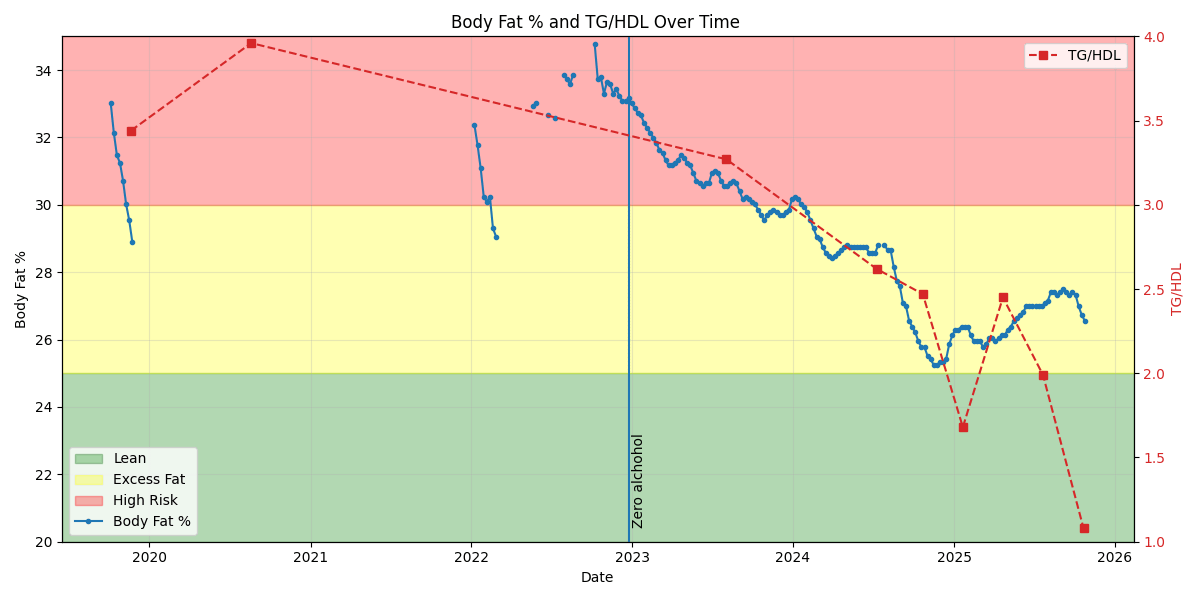
I plotted my body fat percentage and TG/HDL ratio (triglycerides divided by HDL cholesterol) over time.
The TG/HDL ratio is a simple yet powerful marker of insulin resistance and metabolic health – lower values generally indicate better insulin sensitivity.
Body fat percentage was estimated using lean and bone mass data from a recent DEXA scan and regular weight measurements. The earlier part of the timeline reflects irregular weight-loss attempts, while the later period shows steady progress following quitting alcohol.
by nhyper
3 Comments
Yes being fat is the problem not exactly what you eat. What you eat makes achieving thsi goal easier or harder. How much you exercise helps you with mental part of it being hard.
Thats it
Is 1.0 the lowest the TG/HDL ratio could get and is 2.0 the threshold between a good and average ratio? Or is there another reason why you cut off both axis and colour-coded it the way you did ?
Which software did you use for this? I want to start tracking as well. Thanks!