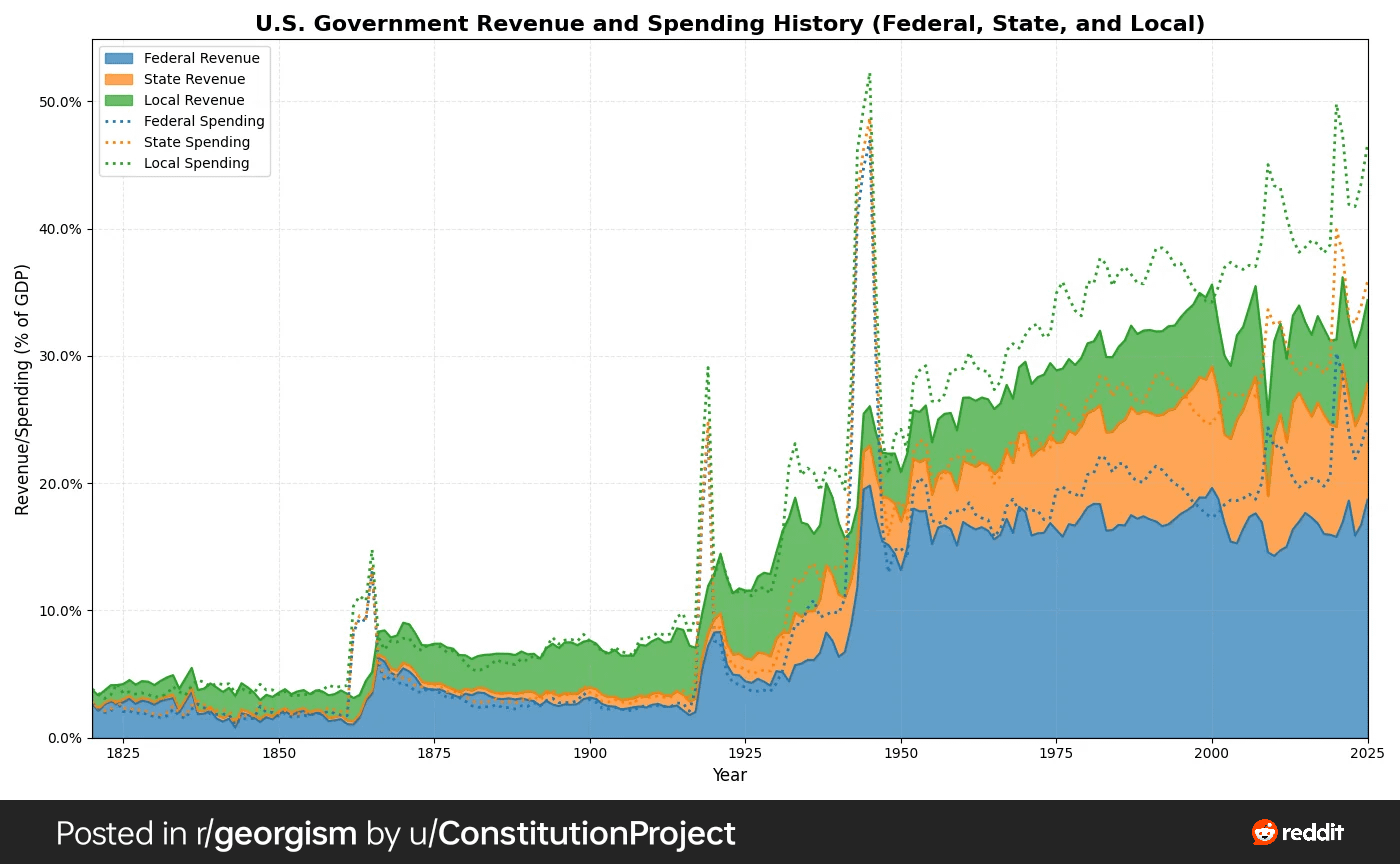
Timeline showing the growth of the government's share of the American economy. by ConstitutionProject
October 23, 2025[OC] Count of OpenStreetMap Automatic License Plate Reader Surveillance Elements every 10 Miles in the Continental US – 10/20/2025
ConstitutionProject on October 23, 2025 4:01 pm The data is from https://www.usgovernmentrevenue.com/revenue_chart_1800_2029USb_27s1li111mcny_F0t The plot was made with matplotlib.
Arendious on October 23, 2025 4:12 pm Heh, everybody bitching about the Federal deficit and spending. Meanwhile, Mayor McCheese is spending next decades’ budget…
TheJuiceIsL00se on October 23, 2025 4:16 pm It’s crazy that the govt’s tax revenue is approximately $5T annually and they spend so much more than that annually.
hedekar on October 23, 2025 4:18 pm Your original title was better https://www.reddit.com/r/dataisbeautiful/s/HJt2MYZE2i
DrTommyNotMD on October 23, 2025 4:37 pm Taxation as a percent of GDP has been high for 70 years but spend just keeps going up. We’re at a point where taxing all millionaires 100% still wouldn’t balance the budget. Something has to be done with the spend.

6 Comments
The data is from https://www.usgovernmentrevenue.com/revenue_chart_1800_2029USb_27s1li111mcny_F0t
The plot was made with matplotlib.
Heh, everybody bitching about the Federal deficit and spending. Meanwhile, Mayor McCheese is spending next decades’ budget…
It’s crazy that the govt’s tax revenue is approximately $5T annually and they spend so much more than that annually.
Your original title was better https://www.reddit.com/r/dataisbeautiful/s/HJt2MYZE2i
Taxation as a percent of GDP has been high for 70 years but spend just keeps going up.
We’re at a point where taxing all millionaires 100% still wouldn’t balance the budget. Something has to be done with the spend.
Clinton the truly fiscally responsable economic goat.