
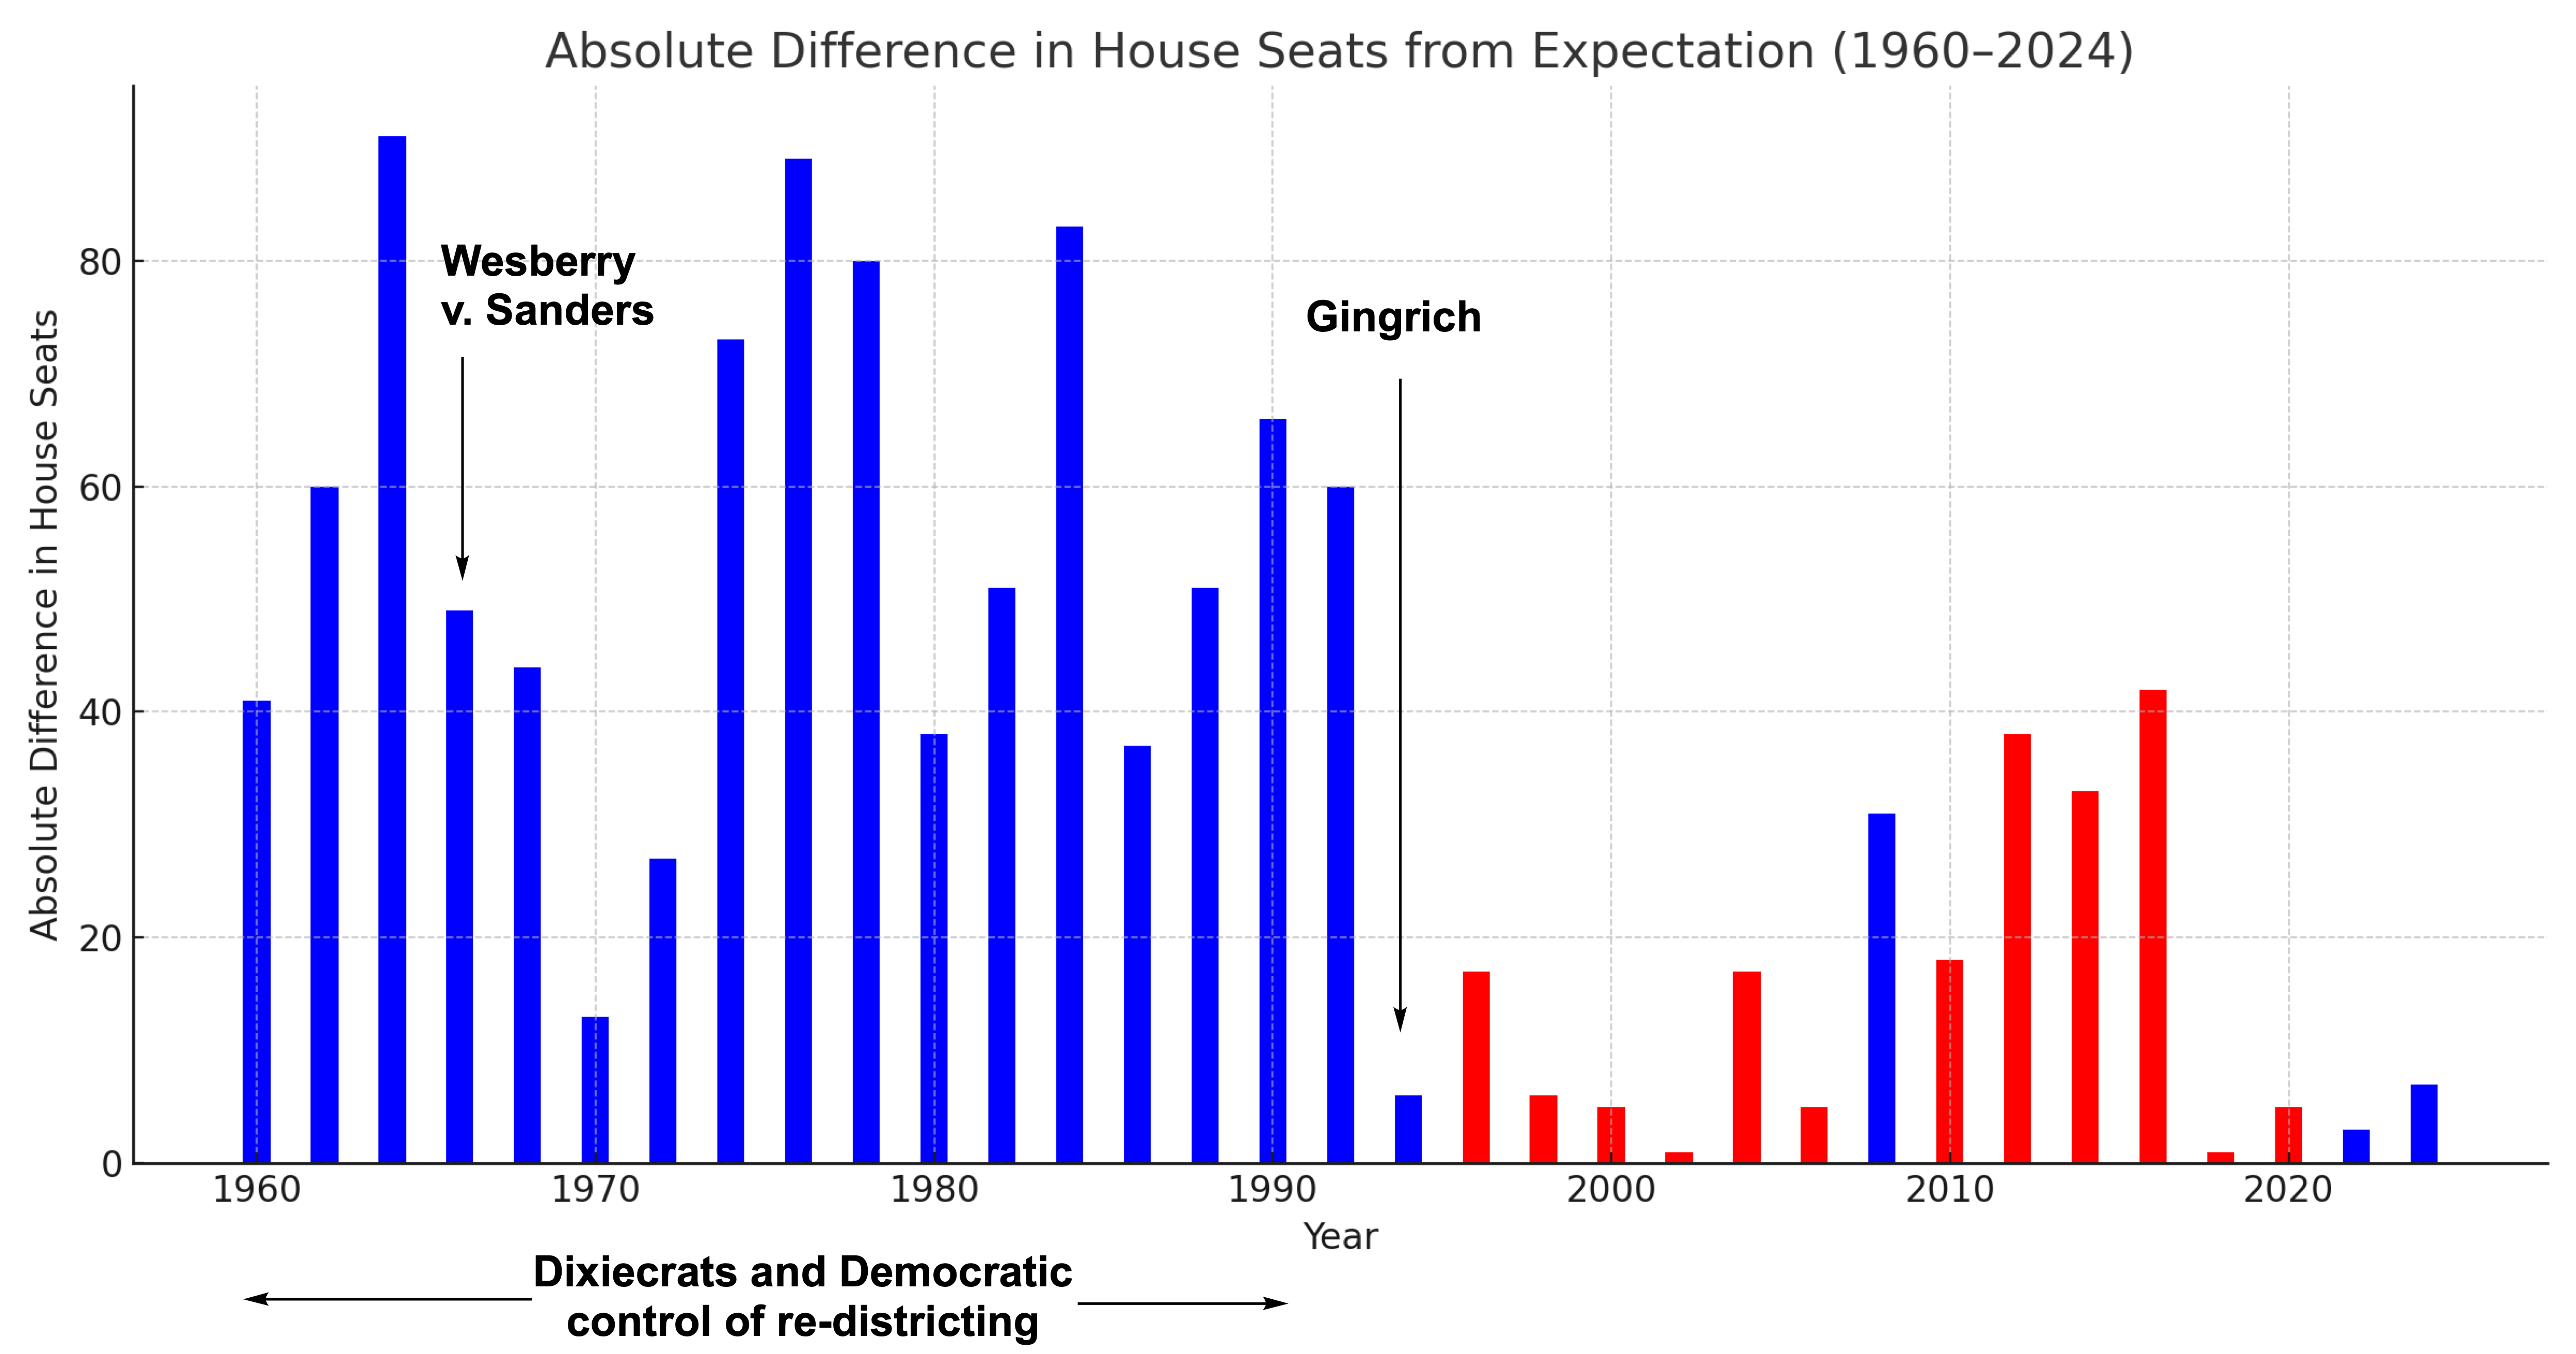
I understand there is a lot to unpack with this graph, but with redistricting in the news and the pending Supreme Court case I was curious to look at imbalances in representation in the House based on raw votes. I realize that the data are masking state-by-state contributions. I didn't know that until Wesberry v. Sanders that "one person, one vote" became law meaning that congressional districts could have wildly different populations. The data were taken from Wikipedia results from each election year.
by penultimatewatch