
Data was taken from the Visual Studio Marketplace every single day for the past 4 years. Visual Studio Marketplace only displays the total installs for an extension, so I wrote a script to get the totals at the beginning of the day, and then at the end of the day, and subtract it to get the daily counts per day.
Some caveats:
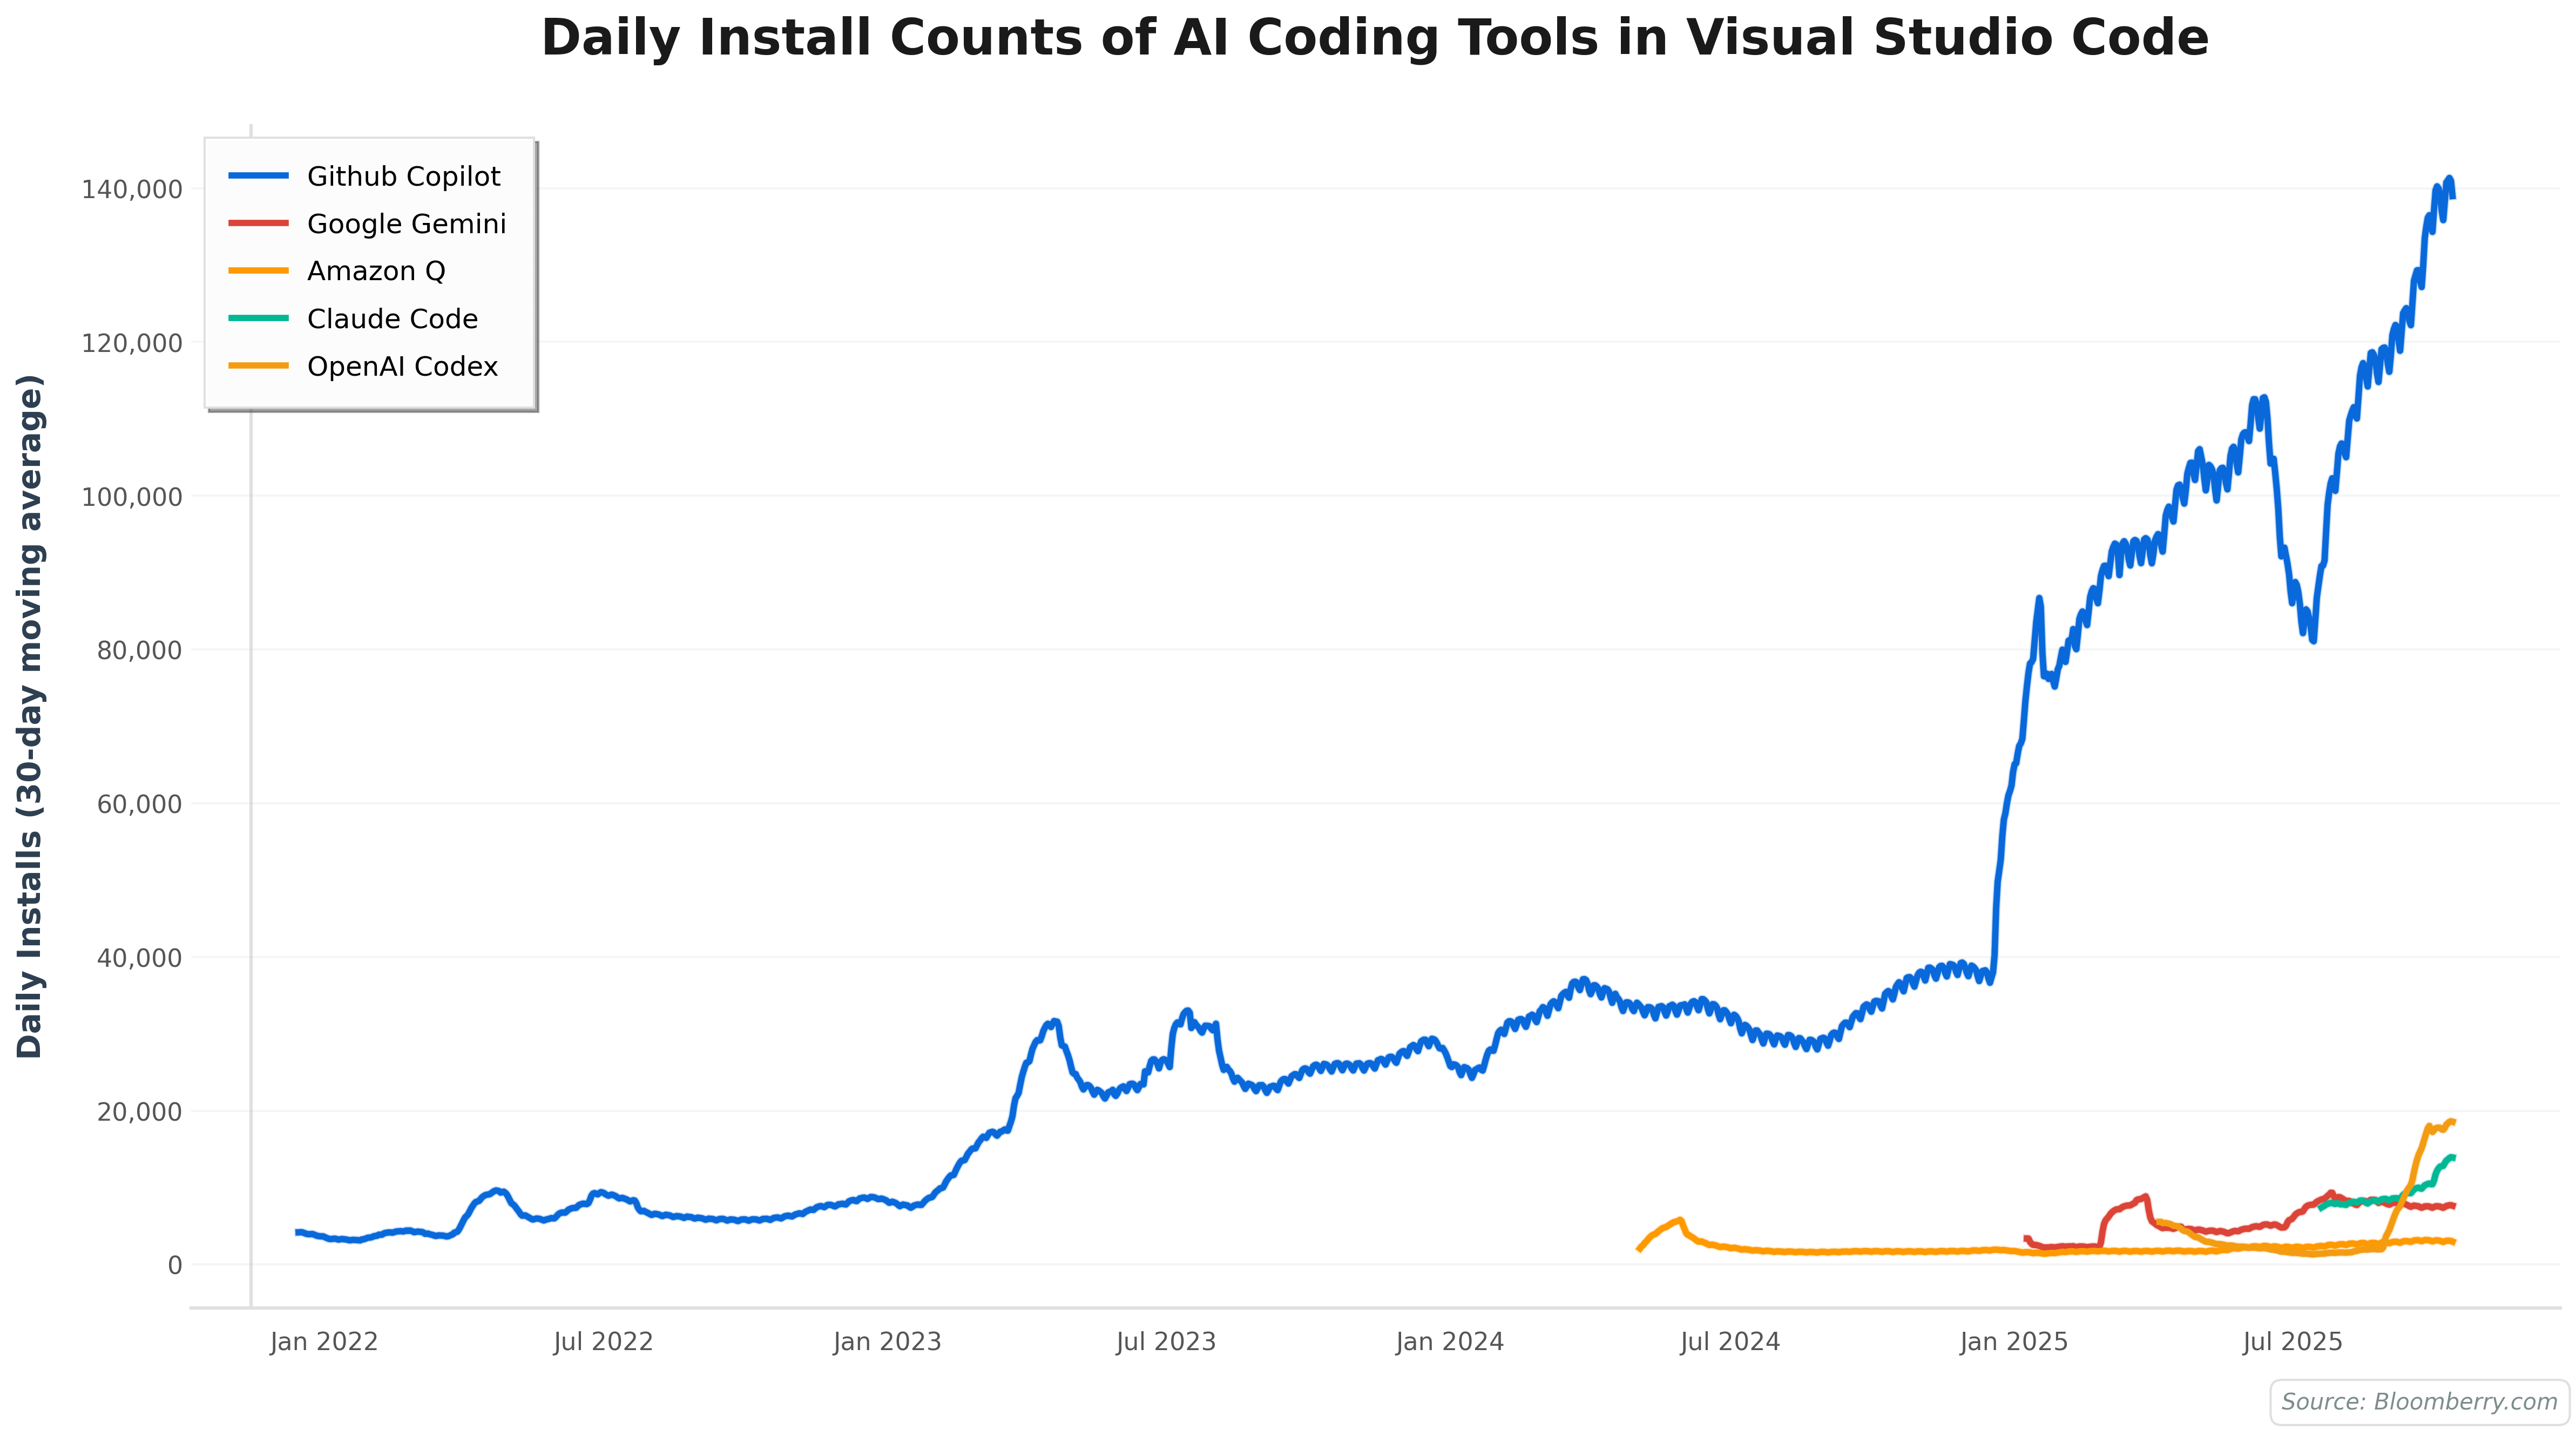
- Some of these tools like Claude Code are used in the CLI, not as an extension.
- Cursor isn't captured, as it's not in the Visual Studio Marketplace (though I did track the # of posts in their support forum over time, and that chart is in the link above)
- This tracks daily installs per day, NOT total installs. Otherwise the charts would be boring and always go to the top and right.
Still, directionally I thought it would be useful to track the popularity of all these AI coding tools in VS Code.
I built an interactive dashboard to track install counts over time for any of 20 AI coding tools here if you want to play with the data: https://bloomberry.com/coding-tools.html
And as for the dashboard, yes, I used an AI Coding tool – it was Claude (not Claude Code)
by Flat_Palpitation_158
4 Comments
Would’ve figured Claude Code would be more popular, leagues above Copilot in my experience, but suppose it is paid and it’s still early days for the extension.
Copilot was included in the latest update of Visual studio, are you taking this into account?
absolutely not beautiful. You have two lines that are essentially the same color – that’s something you should have learned not to do in graph-making 101 people! I expect better work from you on your next assignment, I know you’re capable of it.
Let’s talk about Amazon Q and OpenAI Codex. Who’s mom and who’s dad?