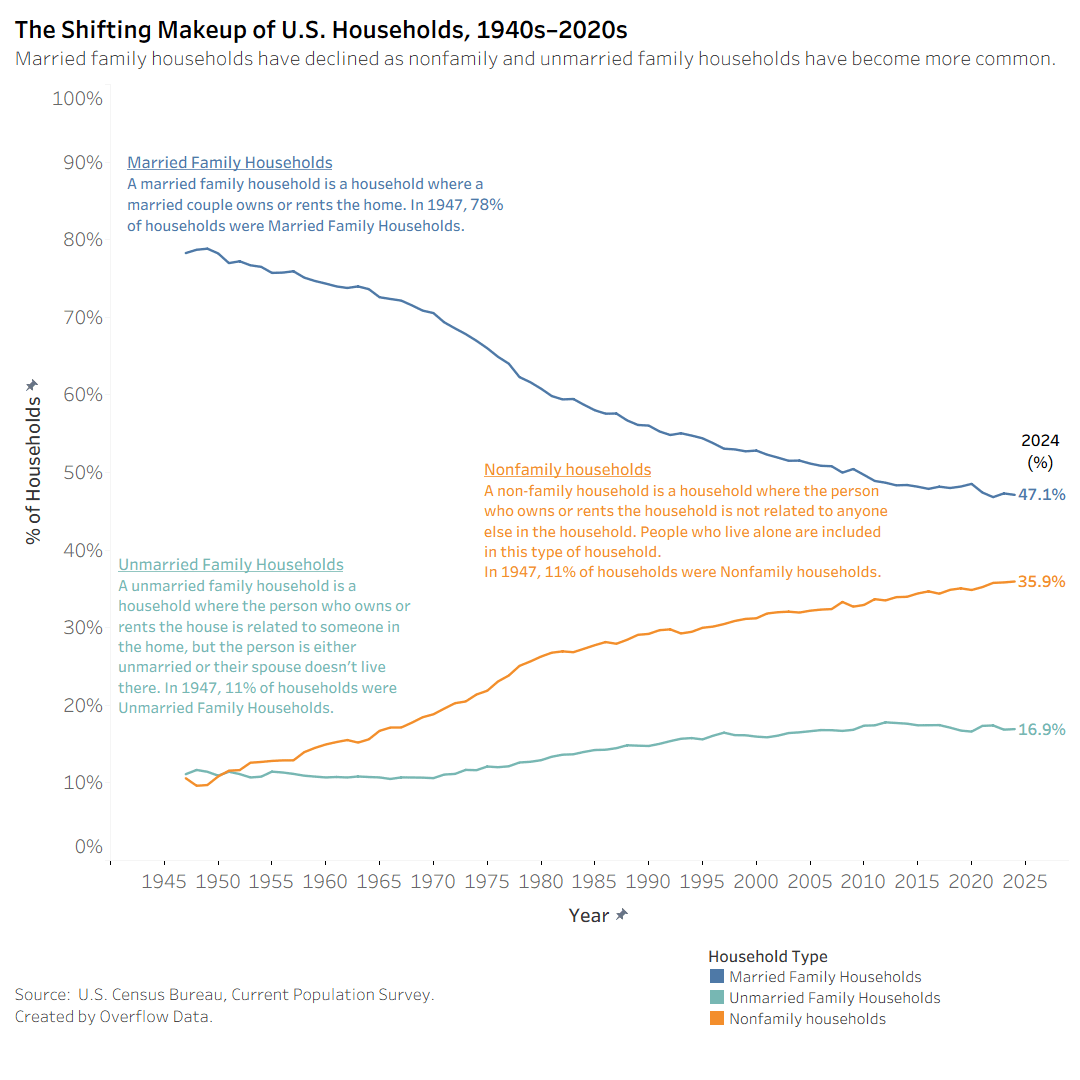
In 1947, nearly 8 in 10 U.S. households were married family households. Today, that share has dropped to 47%, while nonfamily households (people living alone or with unrelated roommates) have climbed from 11% to 36%.
Meanwhile, unmarried family households, such as single-parent or multigenerational homes, have also grown steadily to 17%.
This chart tracks how household types have shifted over the past 75 years, showing a major transformation in how Americans live and form families.
I’d be kind of interested to break out the married category between [married with children at home] and [married without children at home].
In the 1940s, that second category would be mostly reserved for young couples in their first year or two of marriage, and empty nesters after the last of many children moved out. For empty nesters, that might be after 40+ years of living with at least one child at home (e.g., first kid born 1910 at age 20, last kid born 1930 at age 40, leaving you to have kids at home for decades before finally becoming an empty nester at age 60 in 1950).
Today, a huge number of married couples are childfree altogether, and even if they eventually have kids, they generally start later in life and have fewer kids. It would be very rare for a couple today to be actively raising kids at home from age 20 to 60 as in the example above.
Bill_Nihilist on
I really wonder how this (and the overall aging population) affect various metrics like median household income or net worth.
semideclared on
In all of the housing talk and blame for housing costs this is the issue that gets missed
So if the town has 253 people living there in the 99 homes it has
* 30 Homes had a Couple with no Kids
* 60 People need 30 homes
* 44 Homes had a Family of 3.5
* 154 People need 44 Homes
* 13 Homes for those that live by themselves for 13 people
* 13 People need 13 Homes
* 8 Homes for those that live with Roommates
* 16 People need 8 Homes
* 4 Homes for the Single Parents
* 10 People need 4 Homes
As the years go on and this unfolds
* 29 Homes had a Couple with no Kids
* 58 People need 29 homes
* 18 Homes had a Family of 3.5
* 63 People need 18 Homes
* 29 Homes for those that live by themselves for 29 people
* 29 People need 29 Homes
* 16 Homes for those that live with Roommates
* 32 People need 16 Homes
* 7 Homes for the Single Parents
* 18 People need 7 Homes
Thats 200 People living in 99 homes
And the same 53 People from before live where?
Thats gonna require new housing…………before even adding in the 3 people that moved in to town every year

4 Comments
In 1947, nearly 8 in 10 U.S. households were married family households. Today, that share has dropped to 47%, while nonfamily households (people living alone or with unrelated roommates) have climbed from 11% to 36%.
Meanwhile, unmarried family households, such as single-parent or multigenerational homes, have also grown steadily to 17%.
This chart tracks how household types have shifted over the past 75 years, showing a major transformation in how Americans live and form families.
Made with [Tableau](https://public.tableau.com/app/profile/overflowds/vizzes)
An interactive version is avalible at [overflowdata.com](https://overflowdata.com/time-series/the-evolving-shape-of-the-american-household/).
I’d be kind of interested to break out the married category between [married with children at home] and [married without children at home].
In the 1940s, that second category would be mostly reserved for young couples in their first year or two of marriage, and empty nesters after the last of many children moved out. For empty nesters, that might be after 40+ years of living with at least one child at home (e.g., first kid born 1910 at age 20, last kid born 1930 at age 40, leaving you to have kids at home for decades before finally becoming an empty nester at age 60 in 1950).
Today, a huge number of married couples are childfree altogether, and even if they eventually have kids, they generally start later in life and have fewer kids. It would be very rare for a couple today to be actively raising kids at home from age 20 to 60 as in the example above.
I really wonder how this (and the overall aging population) affect various metrics like median household income or net worth.
In all of the housing talk and blame for housing costs this is the issue that gets missed
So if the town has 253 people living there in the 99 homes it has
* 30 Homes had a Couple with no Kids
* 60 People need 30 homes
* 44 Homes had a Family of 3.5
* 154 People need 44 Homes
* 13 Homes for those that live by themselves for 13 people
* 13 People need 13 Homes
* 8 Homes for those that live with Roommates
* 16 People need 8 Homes
* 4 Homes for the Single Parents
* 10 People need 4 Homes
As the years go on and this unfolds
* 29 Homes had a Couple with no Kids
* 58 People need 29 homes
* 18 Homes had a Family of 3.5
* 63 People need 18 Homes
* 29 Homes for those that live by themselves for 29 people
* 29 People need 29 Homes
* 16 Homes for those that live with Roommates
* 32 People need 16 Homes
* 7 Homes for the Single Parents
* 18 People need 7 Homes
Thats 200 People living in 99 homes
And the same 53 People from before live where?
Thats gonna require new housing…………before even adding in the 3 people that moved in to town every year