
Data: FRED / ICE BofA
Analysis & Visualization Packages in R: fredr, tidyverse, lubridate, scales, showtext, patchwork
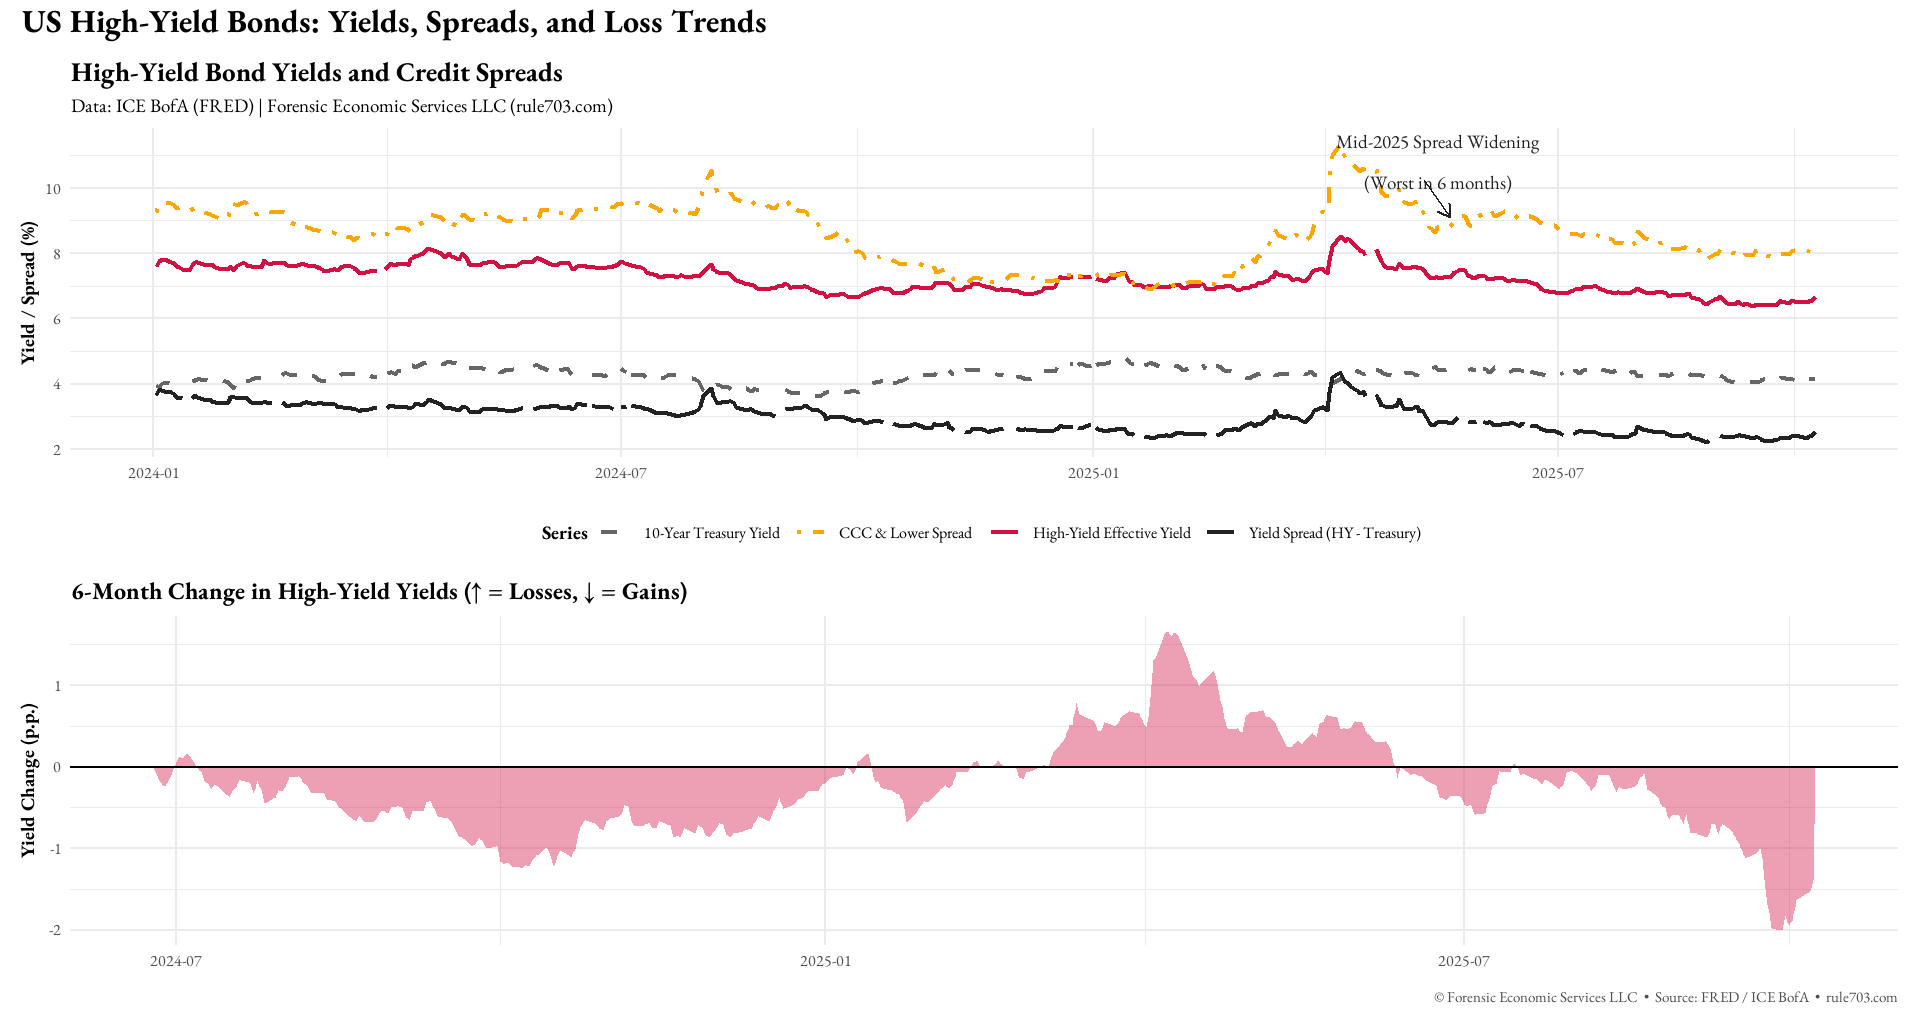
This chart shows how interest rates on “junk” (high-yield) bonds — loans to riskier companies — jumped sharply in mid-2025. That spike means investors suddenly demanded higher returns to lend money to those firms — a sign of growing fear about defaults or slower growth.
The orange line shows the riskiest bonds (CCC-rated). Those yields shot up above 10%.
The red line shows the broader high-yield market, which also rose.
The black line shows the spread — the extra interest junk bonds pay over safe U.S. Treasuries. When that number widens, it means stress is rising.
In short:
-Borrowing got more expensive for riskier companies.
-Investors got cautious.
-Markets were flashing warning lights about credit risk.
by forensiceconomics
1 Comment
Why was there a little peak around April?