
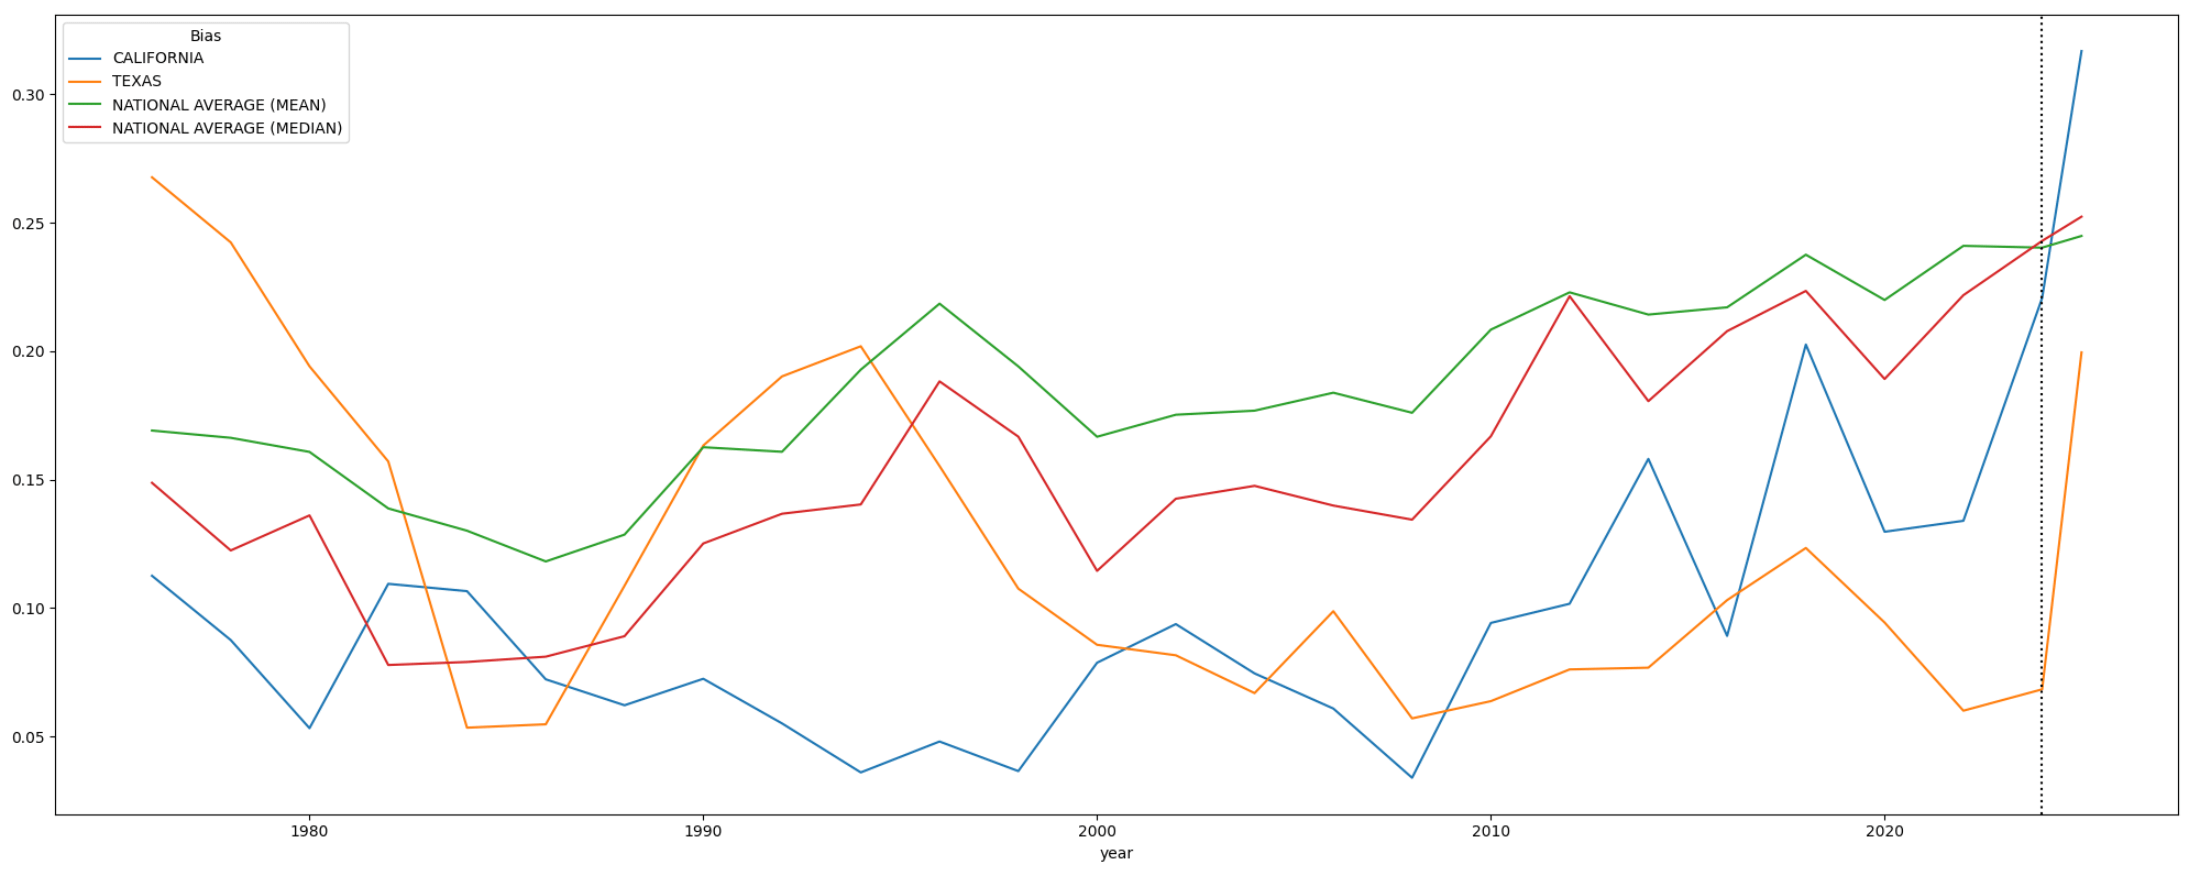
In an effort to objectively measure political bias in districting across states on a historical basis, I have compiled data from US House of Representative election results for all 50 states (and their districts) going back to 1976, and compared the statewide distribution of votes (by party) to the distribution of winners by district. To measure bias, I used the Gallagher Index.
Data Source:
MEDSL “U.S. House 1976–2024” (district-level returns in CSV via Harvard Dataverse). Covers every general election for U.S. House since 1976 with candidate party, votes, and winners
https://dataverse.harvard.edu/dataset.xhtml?persistentId=doi%3A10.7910%2FDVN%2FIG0UN2
by xoomorg
1 Comment
Data Source:
**MEDSL “U.S. House 1976–2024”** (district-level returns in CSV via Harvard Dataverse). Covers every general election for U.S. House since 1976 with candidate party, votes, and winners
[https://dataverse.harvard.edu/dataset.xhtml?persistentId=doi%3A10.7910%2FDVN%2FIG0UN2](https://dataverse.harvard.edu/dataset.xhtml?persistentId=doi%3A10.7910%2FDVN%2FIG0UN2)
Reference: [https://en.wikipedia.org/wiki/Gallagher_index](https://en.wikipedia.org/wiki/Gallagher_index)
Jupyter Notebook Code: [https://gist.github.com/wclark/a429dfa2a2bd783de3f85a89b34ce3a6](https://gist.github.com/wclark/a429dfa2a2bd783de3f85a89b34ce3a6)