
I asked an AI model to visualize its own user growth in a clean, isometric (pseudo-3D) line chart.
Just data, color, and a well-crafted prompt ✨
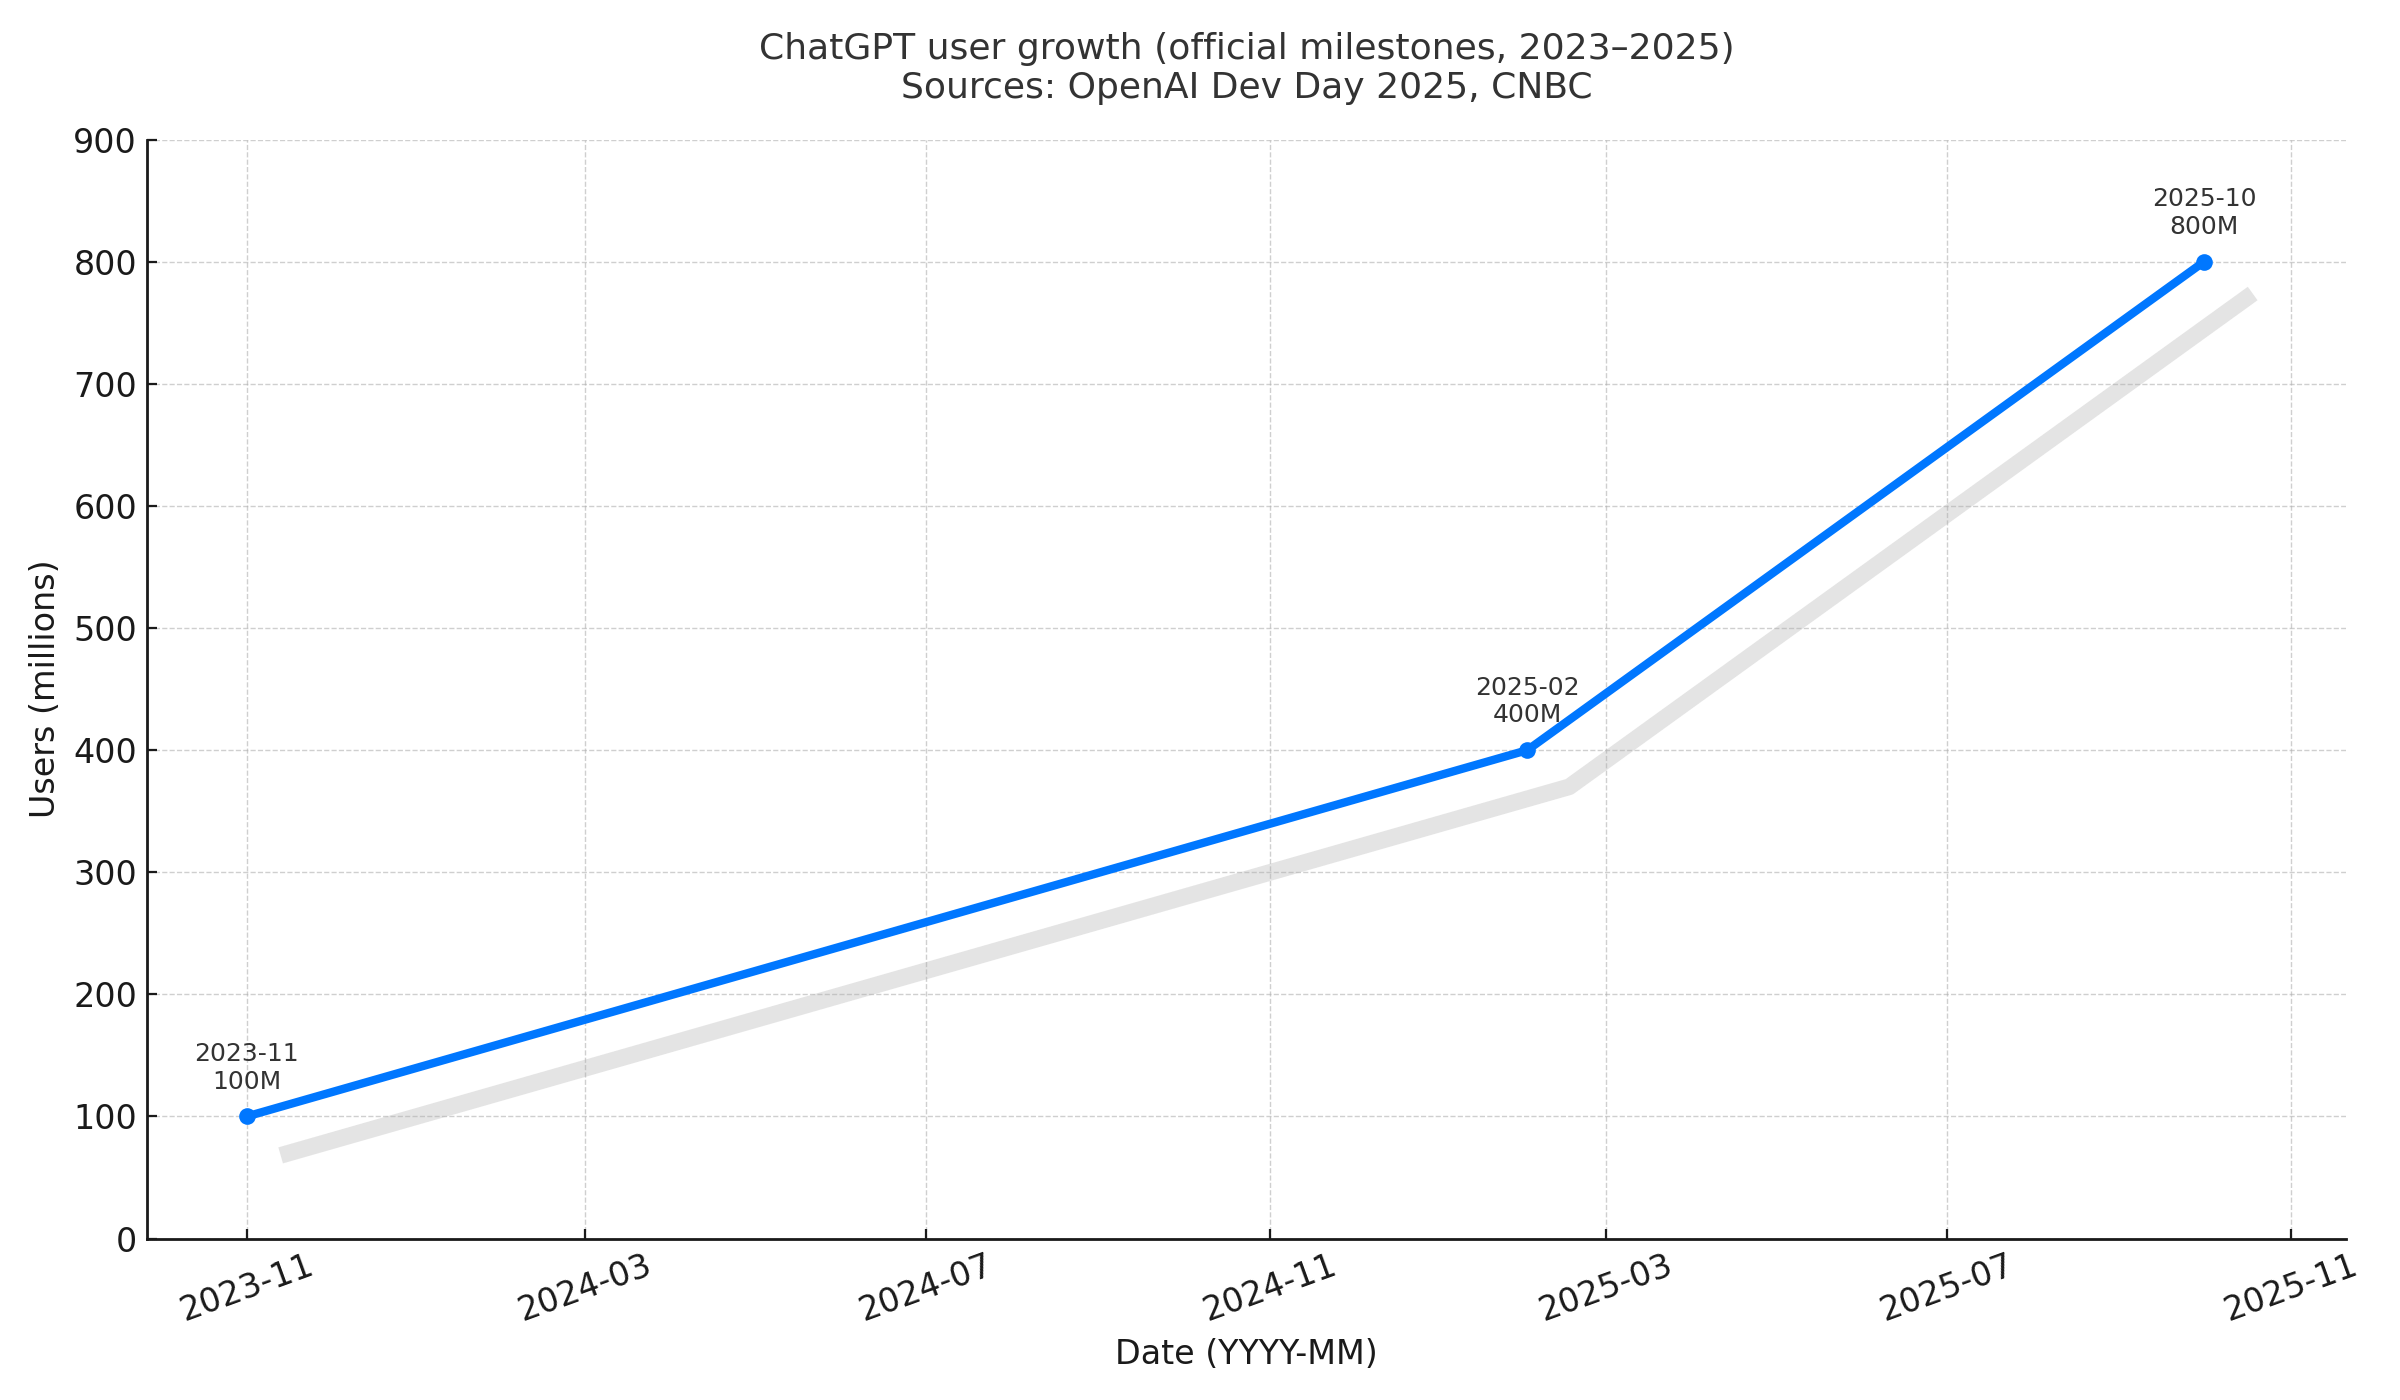
Data (official milestones):
- 2023-11 → 100 M users
- 2025-02 → 400 M users
- 2025-10 → 800 M users
Design specs:
- Blue line (#0077FF) with round dots
- Subtle grey shadow for depth
- Minimalist white background + dotted grid
- Title: “AI user growth (official milestones, 2023–2025)”
- Subtitle: “Sources: OpenAI Dev Day 2025, CNBC”
- Format: PNG 1920×1080
And yes — the AI actually generated the image exactly like that 😎
by blancmaq