
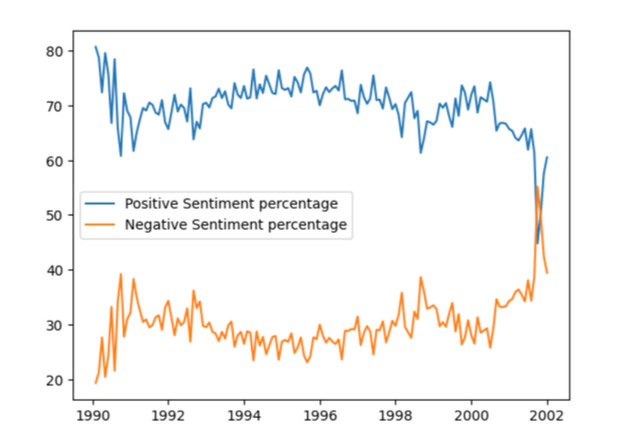
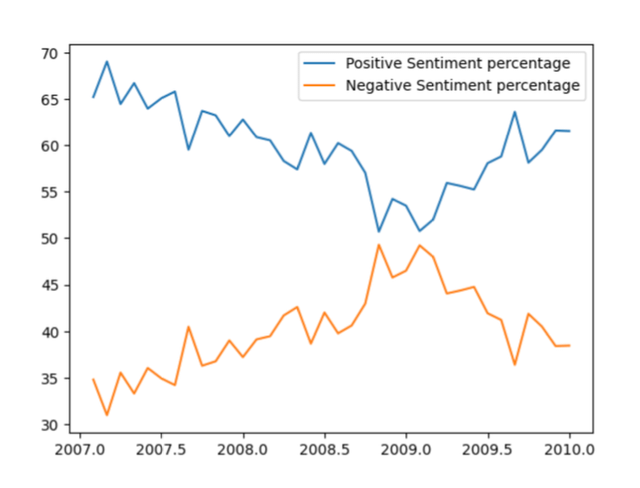
Sentiment Analysis over time of headlines of financial articles from the New York Times. Sentiment was derived using the Vader NLP Model in python. Data has been collected using the NY Times API : https://developer.nytimes.com/apis. Graph visualized using matplotlib in Python.
The sharp fluctuations where positive and negative sentiment get flipped correspond to the DotCom crash and 2007 recession.
by anxious_beaver99
3 Comments
Source : [https://developer.nytimes.com/apis](https://developer.nytimes.com/apis) New York Times developer API for obtaining headlines of articles over the years.
Tools : Python (matplotlib for visualization and Vader for obtaining sentiment)
What about a more recent timeframe? I’d be curious to see how the past few presidencies plus COVID affected sentiment.
OK, Disco Stu. Now show us the sales for 1977 through 1981.