
Some of you may have seen a post a few days ago about a sudden spike in reported choking events for people age 65+. Kinda interesting, and a lot of community feedback about possible problems with the data and some expected jokes about the likely culprit (Werther's, Nutella, transparent lifesavers, etc).
Anyway, it caught my eye because the data is easily available at the FDA CAERS (food, drug, and Cosmetics Adverse Event Reporting System?) downloads in a relatively straightforward format, https://open.fda.gov/data/downloads/, so it's possible to actually look at the data and find out.
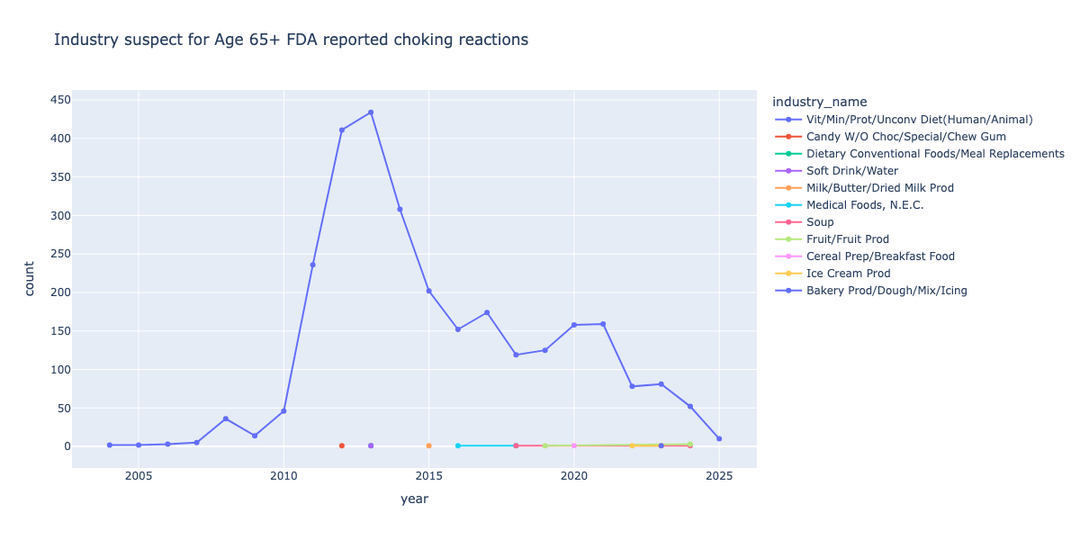
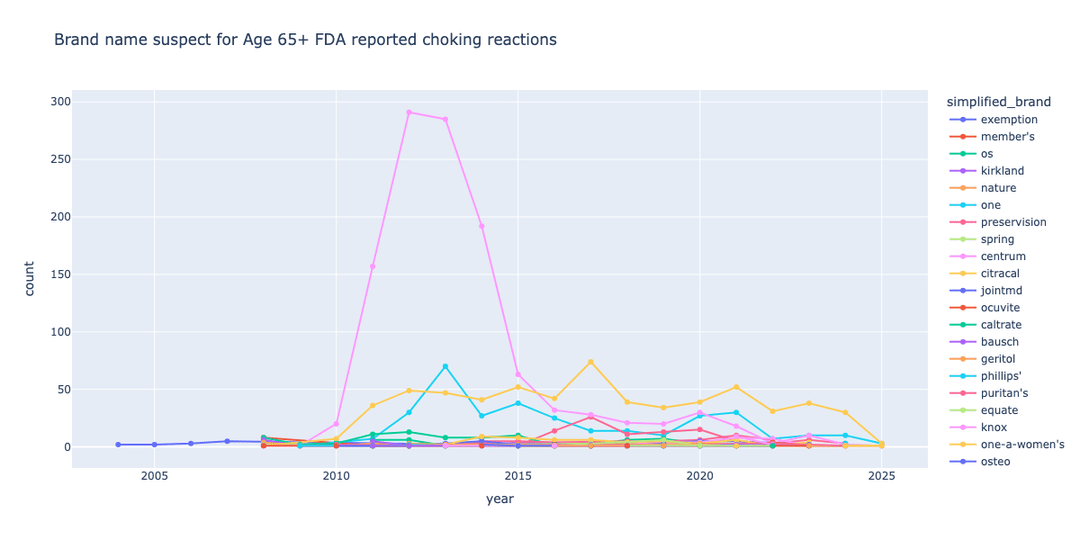
Short answer? It's multi-vitamins (first plot), specifically Centrum multi-vitamins (second plot). I don't know about the timing, but 2012 does align with the release of a now largely debunked study linking Centrum multi-vitamin use to a decrease in cancer rates. Not sure about why the spike actually seems to start in 2011, but could be something off with the timing of the reports to the FDA
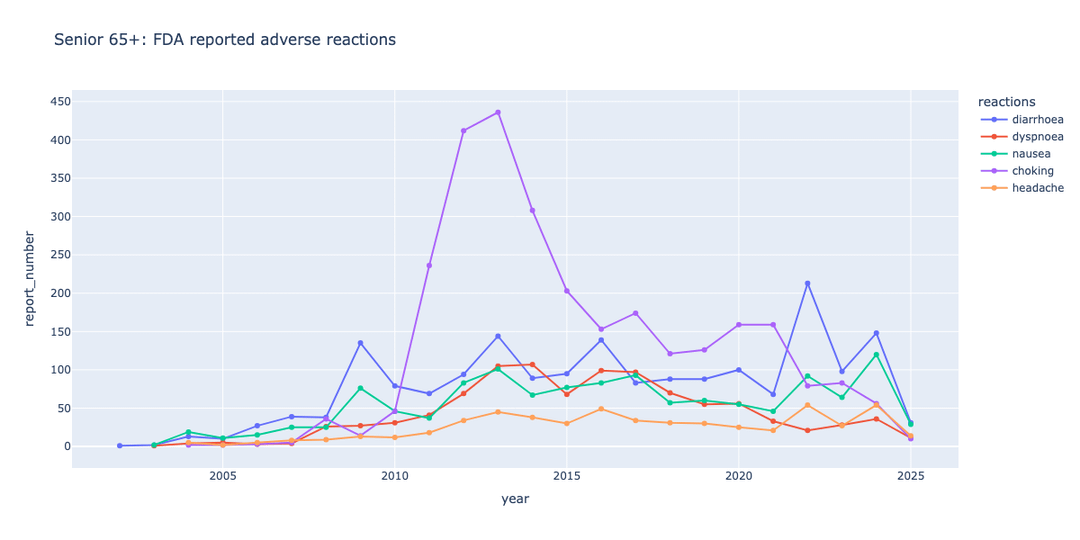
These plots aren't exactly beautiful, but I also don't have a ton of time these days and thought it would be interesting to look into another poster's content a little more deeply. I also recreated (third plot) the OPs plot to make sure I was looking at the same data. I think it aligns pretty well, though I give the other poster credit for a nicer looking plot.
Data is linked above, and plots were made with python, pandas, and plotly express.
by dotalpha
2 Comments
Some of you may have seen a[ post a few days ago](https://www.reddit.com/r/dataisbeautiful/comments/1nwncns/oc_there_is_a_huge_spike_in_reported_choking/) about a sudden spike in reported choking events for people age 65+. Kinda interesting, and a lot of community feedback about possible problems with the data and some expected jokes about the likely culprit (Werther’s, Nutella, transparent lifesavers, etc).
Anyway, it caught my eye because the data is easily available at the FDA CAERS (food, drug, and Cosmetics Adverse Event Reporting System?) downloads in a relatively straightforward format, [https://open.fda.gov/data/downloads/](https://open.fda.gov/data/downloads/), so it’s possible to actually look at the data and find out.
Short answer? It’s multi-vitamins (first plot), specifically Centrum multi-vitamins (second plot). I don’t know about the timing, but [2012 does align with the release](https://www.nytimes.com/2012/10/18/health/daily-multivitamin-may-reduce-cancer-risk-clinical-trial-finds.html?unlocked_article_code=1.q08.VP34.031yE7YK_knF&smid=url-share) of a now [largely debunked study](https://pmc.ncbi.nlm.nih.gov/articles/PMC8754570/) linking Centrum multi-vitamin use to a decrease in cancer rates. Not sure about why the spike actually seems to start in 2011, but could be something off with the timing of the reports to the FDA
These plots aren’t exactly beautiful, but I also don’t have a ton of time these days and thought it would be interesting to look into another poster’s content a little more deeply. I also recreated (third plot) the OPs plot to make sure I was looking at the same data. I think it aligns pretty well, though I give the other poster credit for a nicer looking plot.
Data is linked above, and plots were made with python, pandas, and plotly express.
My curiosity is satisfied! Thank you for this lol, it was my first question when I saw that graph.