**Methodology**
I merged the above data and used a **min-cost flow algorithm** to assign Census blocks to districts. This approach ensures each district is balanced in population while minimizing distance to create compact districts.
1: Treat each Census block as a supply node (supply = block population).
2: Treat each district center as a sink node (sink = ideal district population).
3: Find min-cost flow from blocks to districts where cost = distance from each block to the district center points.
4: After assignment, re-center the district centers based on the new geometry.
5: Iterate the process until the districts converge, similar to how k-means clustering works.
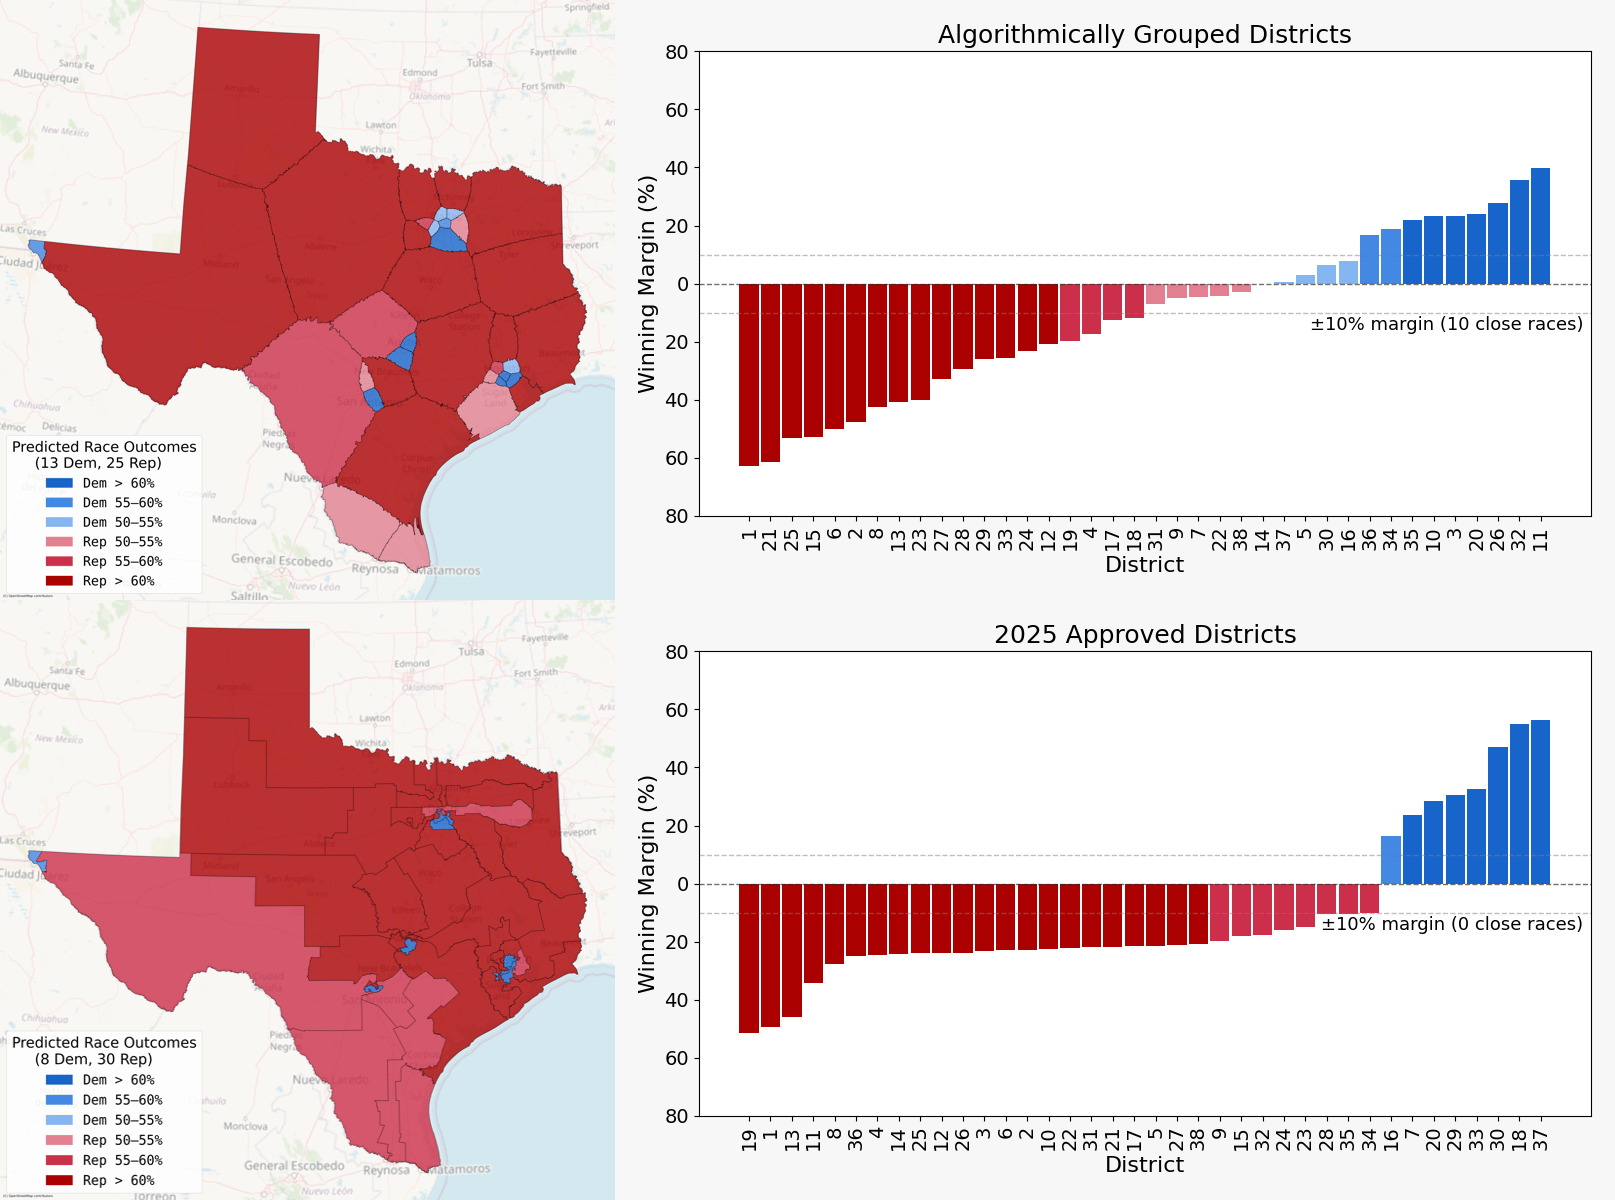
This is a rework of a previous post and I tried to take all of the suggestions into account, the most important being to use 2020 Census data. I also ran this simulation 50 times which resulted in an average of **12.8** Democratic districts and **9.9** “close” districts. The map shown here is typical of that distribution with population deviation < 0.05% (a couple hundred people) in every district.

1 Comment
**Data Sources**
[Texas Census VTD population data](https://data.capitol.texas.gov/dataset/vtds)
[Redistricting Data Hub: 2024 Texas election results](https://redistrictingdatahub.org/dataset/texas-2024-general-election-precinct-level-texas-vtd-results-and-boundaries/)
[2020 PL 94-171 Census Shapefiles](https://www2.census.gov/geo/tiger/TIGER2020PL/STATE)
**Tools**
[OpenStreetMap](https://www.openstreetmap.org/) (basemaps)
[GeoPandas](https://geopandas.org/) (geospatial analysis)
[Matplotlib](https://matplotlib.org/) (plotting)
**Methodology**
I merged the above data and used a **min-cost flow algorithm** to assign Census blocks to districts. This approach ensures each district is balanced in population while minimizing distance to create compact districts.
1: Treat each Census block as a supply node (supply = block population).
2: Treat each district center as a sink node (sink = ideal district population).
3: Find min-cost flow from blocks to districts where cost = distance from each block to the district center points.
4: After assignment, re-center the district centers based on the new geometry.
5: Iterate the process until the districts converge, similar to how k-means clustering works.
This is a rework of a previous post and I tried to take all of the suggestions into account, the most important being to use 2020 Census data. I also ran this simulation 50 times which resulted in an average of **12.8** Democratic districts and **9.9** “close” districts. The map shown here is typical of that distribution with population deviation < 0.05% (a couple hundred people) in every district.
[Interactive map is available here.](https://jwcornv.github.io/interactive_maps/interactive_results_census.html)
(Boundary artifacts are due to compression for faster loading)