
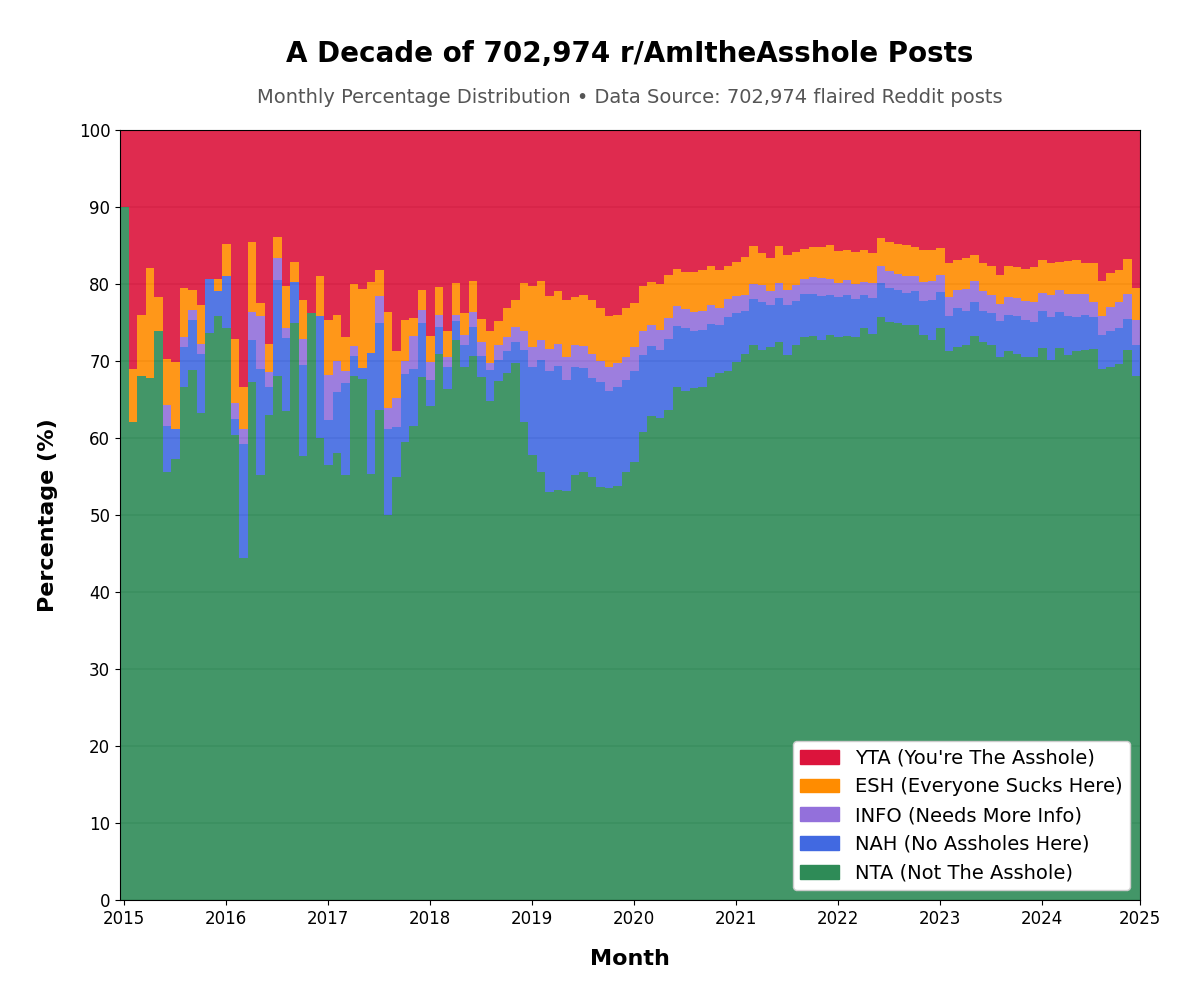
Sources: pushshift dump dataset of all posts on r/AmItheAsshole from subreddit creation up until end of 2024, totalling 7.53 GB (2,503,443 posts, approx 700k of which are flaired with the result YTA/ESH/INFO/NAH/NTA)
Tools: Golang code for data cleaning & parsing, Python code & matplotlib for data visualization
by GeorgeDaGreat123
11 Comments
happy to answer anyone’s questions about methodology
2019, the No Assholes Here bubble
Funny that when people are allowed to tell only their side of a story, they come across better!
Any theories on why the world had less assholes during 2019?
Huh I’m not on that sub all that frequently but I am surprised that YTA is not the majority here overall. Maybe those are just the ones that get the most traction?
What’s with the graph getting smoother, is that due to increased traffic?
I must not know how to read this type of graph… It looks to me that 100% of posts = YTA and no matter where you look the YTA,ESH,INFO,NAH,NTA adds up to over 100% which doesn’t make sense… help me understand? thx
So looking at timelines, some serious volatility before 2018-2019ish. Does anyone with memory of those days know if that was before maybe some stronger guidelines started being enforced, or some change in handling of the sub?
Then 2019, I would call a COVID bubble. Folks dealing with COVID related disruptions to their lives, and they piled into that sub for validation/advice/karma because they were isolated and bored.
Great data analysis, thanks for sharing, that plot is cleannnnnnn.
I’m wondering why the distribution is so rocky for ESH, INFO, and NAH posts earlier in the decade.
Signal suddenly gets less noisy around 2019?